In RINEARN Graph 2D, you can not only plot graphs from data files but also generate graphs directly from mathematical expressions. This feature is referred to as "Math Plotting". This section provides an explanation of how to use this feature.
Additionally, this section explains the syntax used to write expressions for the math plotting tool.
The tools used for math plotting are developed using the VCSSL programming language, which is natively supported by RINEARN Graph 2D (For details, refer to "Control and Automation with VCSSL"). These tools can be launched from the "Program" menu at the top of the graph screen.
There are several tools available depending on the form of the mathematical expressions. These tools are also released as standalone applications, and detailed usage instructions are available on their respective web pages. Below is a list of the tools and an overview of each.
| Overview |
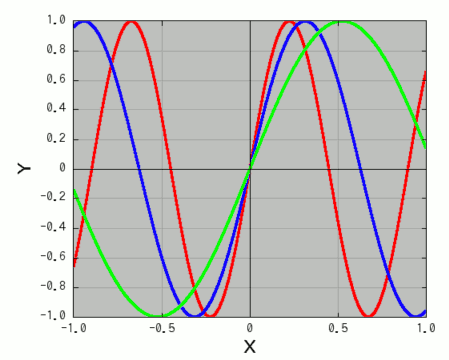
Plots mathematical expressions in the y(x) format as 2D line graphs.
|
| Usage | After launching the tool, enter the formula in the input field labeled "y(x) =" and press the "Plot" button to draw the formula as a 2D graph. You can also specify the range and plot density. |
| Details | https://www.vcssl.org/en-us/code/archive/0001/5000-graph2d-input-yx/ |
| Overview | Animates mathematical expressions in the y(x,t) format as 2D line graphs. |
| Usage | After launching the tool, enter the formula in the input field labeled "y(x,t) =" and press the "Plot" button. The formula will be drawn as a 2D graph, with "t" treated as a time variable for animation. You can also specify the range and plot density. |
| Details | https://www.vcssl.org/en-us/code/archive/0001/5400-graph2d-input-yxt/ |
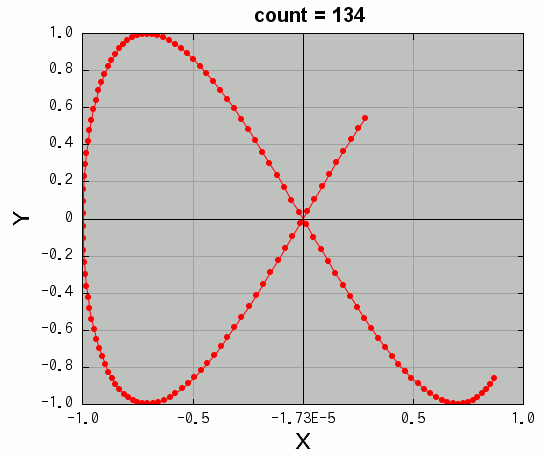
| Overview | Animates mathematical expressions in the x(t), y(t) format with "t" as a parameter. |
| Usage | After launching the tool, enter the formulas in the input fields labeled "x(t) =" and "y(t) =", then press the "Plot" button to draw the formulas as 2D graphs with "t" as the parameter. Press the "Animate" button to play an animation where the graph is drawn gradually from the starting point to the ending point. |
| Details | https://www.vcssl.org/en-us/code/archive/0001/5200-graph2d-input-xt-yt/ |
If needed, you can also use the legacy formula plotting tool from before RINEARN Graph 2D supported VCSSL. It is accessible from the menu at the top of the graph screen under "Tools" > "(Legacy) Math Plot".
This legacy tool only supports z(x,y) format graphs, and you must write variables like <x> and <y> surrounded by angle brackets. Despite its limitations, it is still available for long-time users accustomed to its functionality.
Please note that in this legacy tool, the "log" function represents the common logarithm (log10) rather than the natural logarithm (ln). (In the new tools, "log10" is explicitly used for common logarithms.)
In each math plotting tool, you can input formulas in the designated field, such as "z(x,y) =", using standard mathematical notation.
Math expressions can be written as shown in the following examples:
or
As shown in the examples above, multiplication is denoted by the "*" symbol, and division is denoted by the "/" symbol. Multiplication and division are calculated before addition and subtraction. If you want to prioritize addition or subtraction, enclose the desired part in parentheses, like (y + 2) * 3.
In math expressions, you can use common mathematical functions, such as sin(2 * x) from the earlier examples. Examples of supported functions include the following:
Additionally, many other mathematical functions are supported. For a complete list and details, refer to the VCSSL Math Library documentation.