Result of the execution
As an new feature of Ver.5.6, APIs for controlling RINEARN Graph 3D from programs written in Java*1 lang are now available. In this article, let's control RINEARN Graph 3D practically by using the APIs.
It requires Java Development Kit (JDK) to control RINEARN Graph 3D by using Java language. For installation of JDK, please reference books or web pages explaining programming by Java. In this article, we will not use IDEs for simplification, so we will compile source code and execute programs from command-line terminals.
At first, for checking your environment, let's compile and execute the most simple program using APIs of RINEARN Graph 3D.
At first, let's compile and execute the most simple program using APIs of RINEARN Graph 3D. Please make a text file "Sample0.java" and describe the source code in that as follows :
import com.rinearn.graph3d.RinearnGraph3D;

public class Sample0 {

	public static void main(String[] args) {

		// Launches the graph
		RinearnGraph3D graph = new RinearnGraph3D();
	}
}
Next, allocate the JAR file "RinearnGraph3D.jar" (from the downloaded package) in the same folder with the above source code file.
Then launch a command-line terminal and set the current directory to the above folder (by "cd" command), and compile the source code by typing as follows :
If the compilation have finished successfully, a class file "Sample0.class" should have been generated in the same folder. Finally execute it by typing as follows :
As a result of the execution, the graph window will be launched.
You can compile and execute all sample source code in this article with changing the part "Sample0" in the above commands to "Sample1", "Sample2", ... etc. Please note that the file name (except the extension part) of each sample source code must be the same with the class name.
You can refer API specification documents from the following page. Please refer them for details of each API methods using in this article.
The page of "RinearnGraph3D" class, which is the most important class in the API class library, is the following:
In the following, let's try more practical examples using APIs. All sample code in this article are enclosed in the downloaded package of RINEARN Graph 3D.
The first practical example is, to plot a graph by reading coordinate values described in a text file. Please make the sample data file named with "SampleDataFile1.txt" in the same directory with the source code, and describe the following content in it :
- SampleDataFile1.txt -
In the above content, each text line represents coordinate values of each point ( x y z from the left ), so this 3D data consists of 11 coordinate points.
The sample source code ( Sample1.java ) to plot a graph from the above file is the following :
import com.rinearn.graph3d.RinearnGraph3D;
import java.io.File;
import java.io.FileNotFoundException;
import java.io.IOException;

public class Sample1 {

	public static void main(String[] args) {

		// Launches the graph
		RinearnGraph3D graph = new RinearnGraph3D();

		try {

			// Plots data stored in a file
			graph.openDataFile(new File("SampleDataFile1.txt"));

		// Exception handling
		} catch (FileNotFoundException fnfe) {
			System.err.println("The file is not found");
		} catch (IOException ioe) {
			System.err.println("The file can not be opened");
		}
	}
}
In the above code, firstly we create an instance of the RinearnGraph3D class (a graph window will be launched at this step), and open and then plot the file by calling openDataFile method.
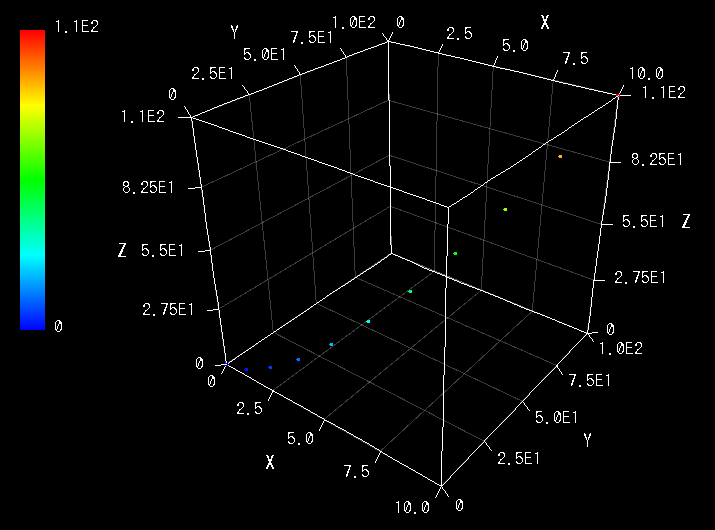
The next practical example is, to plot a graph by reading coordinate values from arrays :
import com.rinearn.graph3d.RinearnGraph3D;

public class Sample2 {

	public static void main(String[] args) {

		// Stores coordinate values in arrays
		int n = 300;
		double[] x = new double[n];
		double[] y = new double[n];
		double[] z = new double[n];
		for(int i=0; i<n; i++) {
			x[i] = i*0.1;
			y[i] = Math.sin(x[i]);
			z[i] = Math.cos(x[i]);
		}

		// Plots data stored in arrays
		RinearnGraph3D graph = new RinearnGraph3D();
		graph.setData(x, y, z);
	}
}
As described in the above code, you can transfer the coordinate values in arrays to the graph by calling setData method.
Data in an array must be aligned in the format of x[ index_of_point ] for single-series graph (the same for y and z). If there are multi series in the data, it must be aligned in an array in the format of x[ index_of_series ][ index_of_point ], or x[ index_of_grand_series ][ index_of_series ][ index_of_point ] (the same for y and z). Lines in the graph are splitted at the bounds of series and colors are changed at the bounded of grand-series (depends on states of plotting options).
By the way, if you want to use MESH / MEMBRANE plotting options, data in an array must be aligned in the format of x[ warp_index ][ weft_index ] (the same for y and z), where warp_index is the index in warp lines of the mesh, and weft_index is index in a weft lines. Which direction is warp (or weft)? It is not necessary to think about it in the case of mesh / membrane plottings.
If you want to export the graph screen to the image file, call exportImageFile method of RinearnGraph3D class. For example, you can export the graph screen of Sample1 or Sample2 to the image "graph.png" file by appending the following code at the end of the main method in Sample1.java or Sample2.java:
import tool.Graph3D;

int graphID = newGraph3D(0, 0, 700, 700, "Graph");
setGraph3DFile(graphID, "test.csv");

// Export the graph to an image file "test.png" (graph ID, image file name, image format)
exportGraph3D(graphID, "test.png", "PNG");
The format of the image file will be decided automatically from the extension of the file name. Only PNG (.png) and JPEG (.jpg) formats are available for the current version. The second argument represents the quality (max:1.0, min:0,0) but it effects only in the case of exporting the file in JPEG format.
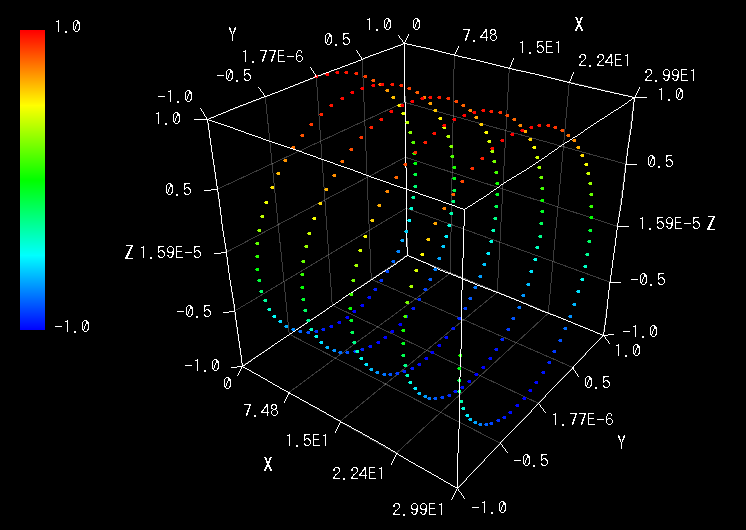
You can edit settings of the graph by some configuration methods. As an example, let's plot the mesh format data (which was mentioned briefly at the end of "How to Plot an Array" section) with enabling the mesh plotting-option, and set ranges of the graph :
import com.rinearn.graph3d.RinearnGraph3D;
import com.rinearn.graph3d.RinearnGraph3DOptionItem;

public class Sample3 {

	public static void main(String[] args) {

		// Stores coordinate values in arrays
		int n = 80; // The number of sectors of the mesh per each directions
		double[][] x = new double[n+1][n+1]; //num of vertices is num of sectors+1
		double[][] y = new double[n+1][n+1];
		double[][] z = new double[n+1][n+1];
		for(int i=0; i<=n; i++) {
			for(int j=0; j<=n; j++) {
				x[i][j] = i * 0.1;
				y[i][j] = j * 0.1;
				z[i][j] = Math.sin(x[i][j]) * Math.sin(y[i][j]);
			}
		}

		// Launches graph, and plots data stored in arrays
		RinearnGraph3D graph = new RinearnGraph3D();
		graph.setData(x, y, z);

		// Settings of plotting options
		// (disables point-plotting and enables mesh-plotting)
		graph.setOptionSelected(RinearnGraph3DOptionItem.POINT, false);
		graph.setOptionSelected(RinearnGraph3DOptionItem.MESH, true);

		// Range settings
		graph.setXRange(0.0, 5.0);
		graph.setYRange(0.0, 5.0);
		graph.setZRange(-1.0, 1.0);
	}
}
In the above code, firstly we enable the mesh-plotting option by calling setOptionSelected method with the first argument RinearnGraph3DOptionItem.MESH ( For the first argument of this method, pass a member of RinearnGraph3DOptionItem enum to specify which plotting option you want to enable/disable ). Then we set X / Y / Z ranges of the graph by calling setXRange / setYRange / setZRange methods.
There are some other setting methods in RinearnGraph3D class but please refer the API reference document for more details. You also can apply the complicate settings by calling loadConfigurationFile method which loads settings from the file. (The setting file can be generated from "File" > "Save Setting" menu of RINEARN Graph 3D.)
Animations can be realized by simply plotting arrays or files repeatedly with changing data little by little in a thread.
However, please note that the processing of setData method does not return to the caller till the plotting will be finished, under the default setting. This behaviour is suitable in the case of exporting image files of all frames without dropping and lacking, but can be cause of the bottleneck in the case of visualizing data inputted from outside (e.g. devices or networks) in real-time.
For such cases, you can change the timings of plotting to asynchronous by calling setAsynchronousPlottingEnabled method with specifying true to the argument. Under that setting, the processing of setData will returns immediately to the caller, and plotting will be executed in asynchronous by another thread at opportune timings. This setting is also useful for taking the animation speed independent from the required time of plotting (which depends largely on the performance of the CPU).
As an practical example, let's visualize data in arrays in real-time by using asynchronous animation plotting ( the data will continuously be updated by the calculation ) :
import com.rinearn.graph3d.RinearnGraph3D;
import com.rinearn.graph3d.RinearnGraph3DOptionItem;
import java.awt.event.WindowListener;
import java.awt.event.WindowEvent;
public class Sample4 implements Runnable, WindowListener {
private Thread thread = null; // Animation thread
private RinearnGraph3D graph = null;
private volatile boolean continuesLoop = true; // Condition flag of the loop of the animation
public static void main(String[] args) {
new Sample4();
}
// Settings of the graph and starting of the animation thread
public Sample4() {
// Launches the graph and sets plotting options (for membrane-plotting)
this.graph = new RinearnGraph3D();
this.graph.setOptionSelected(RinearnGraph3DOptionItem.POINT, false);
this.graph.setOptionSelected(RinearnGraph3DOptionItem.MEMBRANE, true);
// Range setting
this.graph.setXRange(0.0, 5.0);
this.graph.setYRange(0.0, 5.0);
this.graph.setZRange(-1.0, 1.0);
this.graph.setXAutoRangingEnabled(false);
this.graph.setYAutoRangingEnabled(false);
this.graph.setZAutoRangingEnabled(false);
// Make plottings asynchronous with updating of data (for real-time animation)
//ÅiThis setting is not appropriate for exporting imagesÅj
this.graph.setAsynchronousPlottingEnabled(true);
// Registers the window-closing operation implemented in this code to the graph window
// as a event listener, and disables default one
this.graph.addWindowListener(this);
this.graph.setAutoDisposingEnabled(false);
// Creates the animation thread and start
this.thread = new Thread(this);
this.thread.start();
}
// The processing of the animation thread
@Override
public void run() {
int n = 80; // The number of sectors of the mesh per each directions
double[][] x = new double[n+1][n+1]; //num of vertices is num of sectors+1
double[][] y = new double[n+1][n+1];
double[][] z = new double[n+1][n+1];
// The loop of the animationÅicontinues "continuesLoop" is trueÅj
for(int frame=0; this.continuesLoop; frame++) {
double t = frame * 0.05; // time
// Updates data (coordinate values) in arrays
for(int i=0; i<=n; i++) {
for(int j=0; j<=n; j++) {
x[i][j] = i * (5.0/n);
y[i][j] = j * (5.0/n);
z[i][j] = Math.sin(x[i][j]-t) * Math.cos(y[i][j]+t)
* Math.sin(Math.cos(x[i][j]+y[i][j])-2*t-0.7);
}
}
// Transfer data to the graph
// (The plotting will be executed asynchronous)
this.graph.setData(x, y, z);
// Waits 50 milliseconds
try {
this.thread.sleep(50);
} catch(InterruptedException e) {
// Please implement exception handling code here if necessary
}
}
// Disposes the graph when exitted from the animation loop
this.graph.dispose();
// The end-point of the processing of the animation thread:
// the program will end if other threads and resources are not remained
}
// Closing operation of the graph window
@Override
public void windowClosing(WindowEvent e) {
// Exits the animation loop
this.continuesLoop = false;
}
// Other event handlers
@Override
public void windowDeactivated(WindowEvent e) { }
@Override
public void windowActivated(WindowEvent e) { }
@Override
public void windowDeiconified(WindowEvent e) { }
@Override
public void windowIconified(WindowEvent e) { }
@Override
public void windowOpened(WindowEvent e) { }
@Override
public void windowClosed(WindowEvent e) { }
}
3D shapes of graphs are composed of elements such as points, lines, triangles, and quadrangles. We refer them all together as "polygons" (containing points and lines) in this article.
In all previous sections, the drawing process of the 3D shape was done internally by RINEARN Graph 3D based on states of plotting options. However, sometimes you might want to draw 3D shapes manually by combining polygons. For such cases, the API of the 3D graphics engine (renderer) is useful. They provided as methods of RinearnGraph3DRenderer class. You can refer the API specification document of the class from the following page:
By using this API, you can draw points, lines, triangles, and quadrangles freely in 3D space, so RINEARN Graph 3D can also be available as a easy and simple 3D graphics environment for programming.
API methods of the graphics engine are not only called by you but also called by RINEARN Graph 3D internally, so you should think about that things (timing, replotting, ... etc.) in the case of if you want to use the graphics engine's API together with other behaviour (containing manual operations of menus) of RINEARN Graph 3D. For details, we handle it at the next section.
However, if you just want to draw 3D shapes, and do not requires cooperation with menus (and other behaviour) of RINEARN Graph 3D, you can write code very simply as follows:
import com.rinearn.graph3d.RinearnGraph3D;
import com.rinearn.graph3d.renderer.RinearnGraph3DRenderer;
import java.awt.Color;
public class Sample5 {
public static void main(String[] args) {
// Lanches the graph and gets the instance of the graphics engine (renderer)
RinearnGraph3D graph = new RinearnGraph3D();
RinearnGraph3DRenderer renderer = graph.getRenderer();
// Range settings
graph.setXRange(1.0, 10.0);
graph.setYRange(1.0, 10.0);
graph.setZRange(1.0, 10.0);
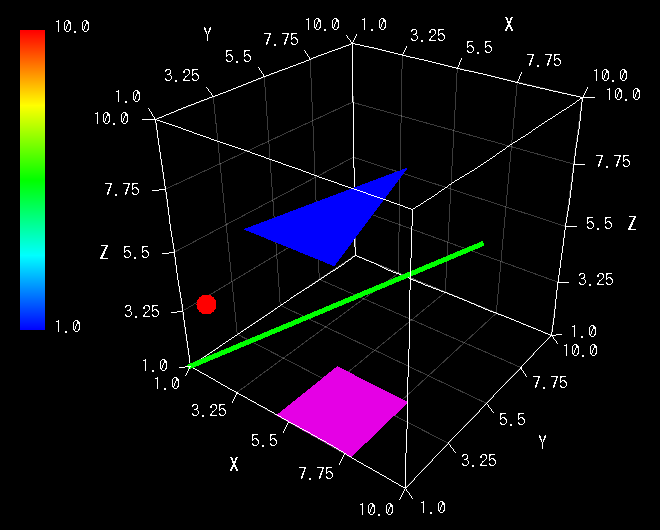
// Draws a red point at the coodinate (1,2,3) with a radius of 10 pixels
renderer.drawPoint(1.0,2.0,3.0, 10.0, Color.RED);
// Draws a green line from (1,1,1) to (8,8,5) with a width of 5 pixels
renderer.drawLine(1.0,1.0,1.0, 8.0,8.0,5.0, 5.0, Color.GREEN);
// Draws a blue triangle with vertices at coordinates (1,4,5), (5,4,5), and (5,8,7)
renderer.drawTriangle(1.0,4.0,5.0, 5.0,4.0,5.0, 5.0,8.0,7.0, Color.BLUE);
// Draws a magenta quadrangle with vertices at (5,1,1), (8,1,1), (8,4,1) and (5,4,1)
renderer.drawQuadrangle(
5.0,1.0,1.0, 8.0,1.0,1.0, 8.0,4.0,1.0, 5.0,4.0,1.0, Color.MAGENTA
);
// Renders the screen (Executes 3DCG rendering)
renderer.render();
}
}
In the above code, firstly we launch a graph and call getRenderer method to get an instance of the RinearnGraph3DRenderer class which provides API methods of the graphics engine. Just after these process we set ranges of the graph. If you want to call other setting methods of RinearnGraph3D class, it must be done at here, before drawing of 3D shapes by calling RinearnGraph3DRenderer class.
Then next, as the most important part of this code, we draw primitive shapes such as a point, a line, a triangle and a quadrangle in 3D space by calling drawPoint, drawLine, drawTriangle, and drawQuadrangle methods of RinearnGraph3DRenderer class.
Finally, we call render method of RinearnGraph3DRenderer class to render an image which is displayed on the screen of the the window. This method executes so-called 3DCG rendering process which projects 3D shapes to the 2D screen and calculates effects of light and shadow. This rendering process will be executed automatically when the angle and position of camera are moved by mouse dragging, but will NOT be executed automatically in the primitive drawing methods (such as drawPoint), because the processing cost of the 3D rendering is relatively heavy. Therefore we explicitly execute it at here.
Under the default settings, coordinate values which are passed as arguments of drawing methods (such as drawPoint) are regarded as coordinates based on the graph coordinate system, so the absolute position in 3D space corresponding with the specified coodinates are depending on the setting of ranges of the graph, and parts at out of ranges of the graph will be clipped. If you want to change these behaviour about drawings, please pass an instance of RinearnGraph3DDrawingParameter class as a last argument of drawing methods instead of an instance of Color.
For the previous sample source code, the drawn content will be erased when settings of the graph (e.g. ranges, options, ... etc.) are modified. It is because RINERARN Graph 3D calls erasing process of the graphics engine (provided as clear method) internally at that timing and then redraws new 3D shapes based on updated settings.
Please note that, such manipulations can be done anytime by the users from the menu bar of the window, not only by calling APIs from your code. You can prevent it by set invisible the menu bar (and light-click menu) by calling setMenuVisible method with passing false as the argument of the method. However, if you want to make your drawing process cooperatable with such manipulations from menus, you can realize it by handling the event which occurs when the re-drawing (re-plotting) are required as follows:
import com.rinearn.graph3d.RinearnGraph3D;
import com.rinearn.graph3d.renderer.RinearnGraph3DRenderer;
import com.rinearn.graph3d.event.RinearnGraph3DPlottingEvent;
import com.rinearn.graph3d.event.RinearnGraph3DPlottingListener;
import java.awt.Color;

public class Sample6 implements RinearnGraph3DPlottingListener {

	RinearnGraph3D graph;
	RinearnGraph3DRenderer renderer;

	public static void main(String[] args) {
		new Sample6();
	}

	// Initialization
	public Sample6() {

		// Lanches the graph and gets the instance of the graphics engine (renderer)
		this.graph = new RinearnGraph3D();
		this.renderer = this.graph.getRenderer();

		// Range settings
		this.graph.setXRange(1.0, 10.0);
		this.graph.setYRange(1.0, 10.0);
		this.graph.setZRange(1.0, 10.0);

		// Registers the handler of plotting event which occurs when re-drawing is necessary
		this.graph.addPlottingListener(this);

		// Executes drawing of 3D shapes, and Renders the screen (Executes 3DCG rendering)
		this.draw();
		this.renderer.render();
	}


	// Drawing of 3D shapes
	public void draw() {

		// Draws a red point at the coodinate (1,2,3) with a radius of 10 pixels
		renderer.drawPoint(1.0,2.0,3.0, 10.0, Color.RED);

		// Draws a green line from (1,1,1) to (8,8,5) with a width of 5 pixels
		renderer.drawLine(1.0,1.0,1.0, 8.0,8.0,5.0, 5.0, Color.GREEN);

		// Draws a blue triangle with vertices at coordinates (1,4,5), (5,4,5), and (5,8,7)
		renderer.drawTriangle(1.0,4.0,5.0, 5.0,4.0,5.0, 5.0,8.0,7.0, Color.BLUE);

		// Draws a magenta quadrangle with vertices at (5,1,1), (8,1,1), (8,4,1) and (5,4,1)
		renderer.drawQuadrangle(
			5.0,1.0,1.0, 8.0,1.0,1.0, 8.0,4.0,1.0, 5.0,4.0,1.0, Color.MAGENTA
		);
	}


	// Handler of plotting event which occurs when re-drawing (re-plotting) is necessary
	@Override
	public void plottingRequested(RinearnGraph3DPlottingEvent e) {

		// Re-executes drawing of 3D shapes
		this.draw();
	}


	// Other handlers
	@Override
	public void plottingCanceled(RinearnGraph3DPlottingEvent e) {
	}
	@Override
	public void plottingFinished(RinearnGraph3DPlottingEvent e) {
	}
}
The content drawn by the above code is completely same with the previous example, Sample5, but the content does not be erased even if you change the setting of ranges of the graph from "Edit" > "Set Range" menu on the menu bar, After that manipuration, all polygons will relocated at correct position in the 3D space based on new ranges.
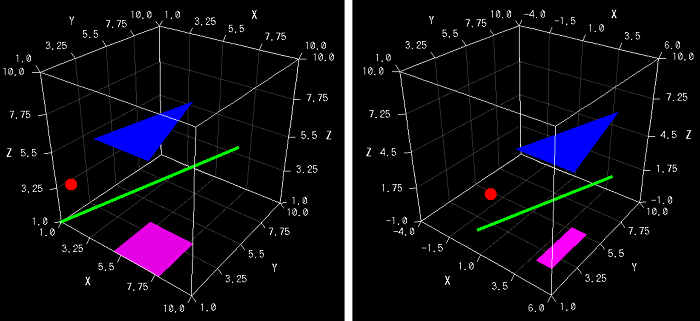
To realize this behaviour, Sample6 class is implementing RinearnGraph3DPlottingListener interface, and is registered as an event listener of RinearnGraph3DPlottingEvent which occurs when re-drawing (re-plotting) is required. When the event occurs, plottingRequested method will be called. In the above code, the behaviour of this method is implemented as simply re-calls drawing process of 3D shapes.
For example, If the plottingRequested method is implemented as code calls setXRange method of RinearnGraph3D class, the processing will fall into an infinite loop, because setXRange method also calls plotRequested method again to re-draw the graph based on the new range setting.
In addition, many API methods of RinearnGraph3D class awaits the completion of drawing / rendering processings if the graphics engine is busy when the API method is called. The processing of plotRequested is regarded as a part of drawing processings, so if it call API methods of RinearnGraph3D class, the callee method will awaits the caller-side process, and it fall into a deadlock state.
When you implement event handling methods of RinearnGraph3DPlottingListener interface, please be careful not to call API methods of RinearnGraph3D class from code of them.