Data File Formats
In this article, we will explain about supported formats of data files for RINEARN Graph 3D.
CSV / TSV Files
For plotting data described in a file by RINEARN Graph 3D, it is necessary to describe coordinate values in a text file,
and each values in a file should be separated by a specific character called as "delimiter".
As a delimiter, the comma (,) and the tab-characters are widely used and they are called, as CSV and TSV files.
- CSV (Comma Separated Values)
- The delimiter is the comma( , ).
- TSV (Tab Separated Values)
- The delimiter is the tab-character. For RINEARN Graph 3D, you can use space-characters instead of tab-characters.
Both of CSV and TSV files are available for RINEARN Graph 3D.
Besides differences of delimiters, there are some formats about alignments of coordinate values.
RINEARN Graph 3D supports "Matrix" and "3-Columns" formats.
Matrix Format
In matrix format, Z values of all coordinate points should be aligned as a matrix, and the row/column of the matrix represents X/Y values of the point.
X values should be described in the first column, and Y values should be described in the first row (the left-top point in data should be a blank.).
The data file of the matrix format can be made by spreadsheet softwares easily as follows, and available for mesh/membrane plottings.
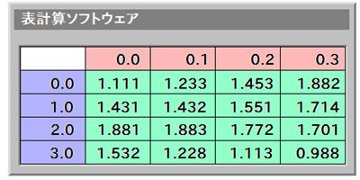
An Example for Generating A Matrix Format Data File by Spreadsheet softwares
To make the file by a spreadsheet software, with leaving the left-top cell blank,
please input X values to the first column, and input Y values to the first row.
Then please fill all cells in the matrix area with Z values of which rows/columns corresponds X/Y values of them.
In the following figure, blue column represents X values, red row represents Y values, and green matrix area represents Z values.
Finally, please export the data as a CSV file, and open by RINEARN Graph 3D.
If succeeded, points (circles) will be plotted at all coordinate points described in the file.
You can plot them as a mesh / membrane by enabling
"With Meshes" / "With Membranes" checkbox from the "Option" menu at the menu bar.
About 3-Columns Format
The matrix format is useful for generating files by spreadsheet softwares.
However, if you want to generate files by programmings, the 3-columns format might be more useful.
In the 3-columns format, each text-line in a data file represents each coordinate point,
and X/Y/Z values of a coordinate point should be described in a text-line, with being separated by the delimiter.
An example of 3-column format data (delimiter : comma)
X1,Y1,Z1
X2,Y2,Z2
X3,Y3,Z3
Åc,Åc,Åc
X100,Y100,Z100
How to contain multiple data-series in one file
You can contain multiple data-series in one file by inserting double-blank-lines for bounds of data-series.
Different data-series will be plotted with different colors when "Gradation" option is disabled.
Alignment
If you want to make 3-columns format file available for mesh / membranes plottings,
data of coordinate points should be aligned as followings.
Step1 : Write coordinate values for all points on a line in the mesh toward X direction from end to end under the fixed Y value.
Step2 : Write a blank line.
Step3 : Change the Y value fixed in Step 1 to the Y value of the neighbour line, and reprocess Step 1. Repeate Step 1 to 3 for all lines in the mesh.
Let us show an example:
Example 3x3 mesh (each points has Z values)
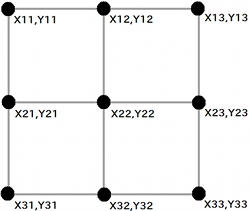
In 3-columns fromat, data of the above mesh is described as follows:
X11 Y11 Z11
X12 Y12 Z12
X13 Y13 Z13
(blank line)
X21 Y21 Z21
X22 Y22 Z22
X23 Y23 Z23
(blank line)
X31 Y31 Z31
X32 Y32 Z32
X33 Y33 Z33
The following are examples of source code of programs to generate data of a mesh in 3-column format.
Let us generate a mesh data of Z = sin( X )+cos( Y ) by a program written in C programming language:
#include <stdio.h>
#include <stdlib.h>
#include <math.h>

int main(void) {

  double x, y, z;
  int xi, yi;
  int xN = 10; // Number of lines for X direction
  int yN = 10; // Number of lines for Y direction

  // Ranges of the graph
  double xMin = -5.0;
  double yMin = -5.0;
  double xMax = 5.0;
  double yMax = 5.0;

  FILE *fp = fopen("a.tsv", "w");
  if (fp == NULL) {
    fprintf(stderr, "failed to open the file");
    return EXIT_FAILURE;
  }

  for( yi=0; yi<yN; yi++ ){
    for( xi=0; xi<xN; xi++ ){

      x = ( xMax - xMin ) * xi / (xN-1);
      y = ( yMax - yMin ) * yi / (yN-1);
      z = sin(x) + cos(y);

      // Write a coordinate point as a text-line
      fprintf(fp, "%lf\t%lf\t%lf\n", x, y, z);

    }
    fprintf(fp, "\n"); // Insert a brank line
  }

  return EXIT_SUCCESS;
}
Let us generate a mesh data of Z = sin( X )+cos( Y ) by a program written in C++:
#include <fstream>
#include <cstdib>
#include <cmath>

int main(){

  double x, y, z;
  int xN = 100; // Number of lines for X direction
  int yN = 100; // Number of lines for Y direction

  // Ranges of the graph
  double xMin = -5.0;
  double yMin = -5.0;
  double xMax = 5.0;
  double yMax = 5.0;

  std::ofstream ofs( "a.tsv" );

  for( int yi=0; yi<yN; yi++ ){
    for( int xi=0; xi<xN; xi++ ){

      x = ( xMax - xMin ) * xi / (xN-1);
      y = ( yMax - yMin ) * yi / (yN-1);
      z = sin(x) + cos(y);

      // Write a coordinate point as a text-line
      ofs<<x<<"\t"<<y<<"\t"<<z<<std::endl;

    }
    ofs<<std::endl; // Insert a brank line
  }
  ofs.close();
  return EXIT_SUCCESS;
}
Let us generate a mesh data of Z = sin( X )+cos( Y ) by a program written in VCSSL:
import Math ;

double x ;
double y ;
double z ;

int xN = 100;  // Number of lines for X direction
int yN = 100;  // Number of lines for Y direction

// Write a coordinate point as a text-line
double xMin = -5.0;
double yMin = -5.0;
double xMax = 5.0;
double yMax = 5.0;

int file = open ( "a.tsv", "wtsv" );

for( int yi=0; yi<yN; yi++ ){
  for( int xi=0; xi<xN; xi++ ){

    x = ( xMax - xMin ) * i / (xN-1) ;
    y = ( yMax - yMin ) * j / (yN-1) ;
    z = sin(x) + cos(y) ;

    // Write a coordinate point as a text-line
    writeln( file, x, y, z ) ;

  }
  writeln( file, "" ) ;  // Insert a brank line
}

close( file )
Let us generate a mesh data of Z = sin( X )+cos( Y ) by a program written in FORTRAN77:
IMPLICIT NONE

REAL*8 X,Y,Z,X_MAX,Y_MAX,X_MIN,Y_MIN
INTEGER X_I,Y_I,X_N,Y_N

X_N = 100 ! Number of lines for X direction
Y_N = 100 ! Number of lines for Y direction
X_MAX = 5.0D0
X_MIN = -5.0D0
Y_MAX = 5.0D0
Y_MIN = -5.0D0

OPEN(UNIT=14,FILE='a.tsv',STATUS='UNKNOWN')

DO Y_I = 0, Y_N
  DO X_I = 0, X_N

    X = (X_MAX-X_MIN)*DBLE(X_I)/DBLE(X_N-1)
    Y = (Y_MAX-Y_MIN)*DBLE(Y_I)/DBLE(Y_N-1)
    Z = SIN(X) + COS(Y)

    ! Write a coordinate point as a text-line
    WRITE(14,*) X, Y, Z

  ENDDO
  WRITE(14,*) ! Insert a brank line

ENDDO
CLOSE( 14 )

STOP
END
Author of This Article
Fumihiro Matsui
[ Founder of RINEARN, Doctor of Science (Physics), Applied Info Tech Engineer ]
Develops VCSSL, RINEARN Graph 3D and more. Also writes guides and articles.
Translation Cooperator
ChatGPT AIs
[ GPT-3.5, 4, 5, 5.1 ]
We greatly appreciate the cooperation of ChatGPT AIs in translating this article.