Graphing Mathematical Expressions
In RINEARN Graph 3D, you can plot graphs not only from data files but also from mathematical expressions.
This feature is called "math plotting". This section explains how to perform math plotting.
Additionally, this section provides details on the syntax used in the formula plotting tool.
The formula plotting tools are developed using VCSSL, a programming language natively supported by RINEARN Graph 3D. (For more details, see Control & Automation with VCSSL).
You can launch these tools from the "Program" menu located at the top of the graph screen.
There are multiple tools available, each suited to different types of expressions.
These tools are also available as standalone programs, and their usage is explained in detail on their respective web pages.
Below is a list of these tools along with their descriptions.
Plotting 3D Graphs in z(x, y) Form
This tool plots 3D surface/mesh graphs from equations in the z(x, y) format.
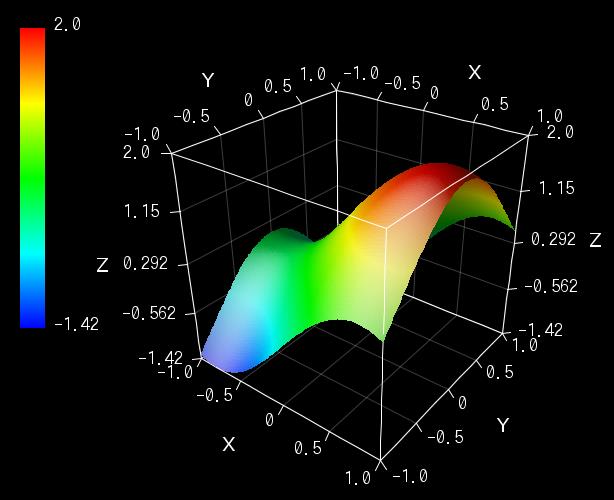
After launching the tool, enter an equation into the "z(x, y) =" field and click the "Plot" button.
This will render the equation as a 3D graph. You can also specify the range and plot density.
» Go to the detailed guide
Plotting 3D Animated Graphs in z(x, y, t) Form
This tool plots 3D surface/mesh graphs with animations from equations in the z(x, y, t) format.
After launching the tool, enter an equation into the "z(x, y, t) =" field and click the "Plot" button.
This will render the equation as a 3D graph, where "t" is treated as a time variable for animation.
You can also specify the range and plot density.
» Go to the detailed guide
Plotting 3D Animated Graphs in x(t), y(t), z(t) Form
This tool plots 3D parametric graphs with animations using x(t), y(t), and z(t) equations.
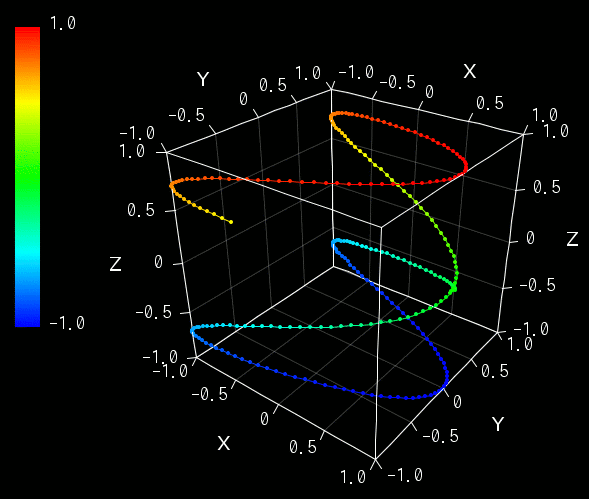
After launching the tool, enter equations into the "x(t) =", "y(t) =", and "z(t) =" fields, then click the "Plot" button.
This will plot a 3D trajectory using "t" as a parameter. Clicking the "Animation" button will gradually render the graph from the start to the end point.
» Go to the detailed guide
Legacy Math Plotting Tool
If needed, you can also use the legacy formula plotting tool from the "Tools" > "(Old) Math Plot" menu.
This tool was available before VCSSL support was introduced in RINEARN Graph 3D.
Unlike the newer tools, this one only supports z(x, y) format and requires variables x and y to be enclosed in <x> and <y> (e.g., <x> + <y>).
It remains available for users who are accustomed to using it in older versions.
Additionally, note that in this old tool, the log() function calculates the common logarithm (log10) instead of the natural logarithm (ln).
(In the newer tools, log10() is used explicitly.)
Writing Mathematical Expressions and Function List
In each formula plotting tool, you can enter mathematical expressions in a standard format in the input field labeled "z(x, y) =", etc.
Example Equations
Here are some examples of how to write equations:
Plotting z = x + y
x + y
Plotting z = x^2 + y^2
pow(x,2) + pow(y,2)
or
x * x + y * y
Plotting z = sin(2x) + cos(3y)
sin(2 * x) + cos(3 * y)
Order of Arithmetic Operations
As shown in the examples above:
- Use "*" for multiplication and "/" for division.
- Multiplication and division have higher precedence than addition and subtraction.
- If you want to prioritize addition/subtraction, enclose those parts in parentheses ( ), e.g., (y + 2) * 3.
Mathematical Functions
In math expressions, you can use common mathematical functions, such as sin(2 * x) from the earlier examples. Examples of supported functions include the following:
- sqrt( )
- Square root
- exp( )
- Exponential function
- log10( )
-
Base-10 logarithm
* Note: In the legacy formula plotting tool under the "Tools" menu, "log" is equivalent to "log10". However, in the new formula plotting tools under the "Program" menu (following the VCSSL specification), "log" is equivalent to "ln". To avoid confusion, it is recommended to use log10 or ln explicitly.
- ln( )
- Natural logarithm (base-e)
- abs( )
- Absolute value
- fac( )
-
Factorial
* Note: In the legacy math plotting tool under the "Tools" menu, use "!( )" for factorials.
- pow( )
-
Exponentiation
* Example: pow(2,3) for 2^3, or pow(-2,-3) for -2^-3.
* Note: In the legacy formula plotting tool under the "Tools" menu, use 2^3 instead.
- sin( )
- Sine (trigonometric function)
- cos( )
- Cosine (trigonometric function)
- tan( )
- Tangent (trigonometric function)
- asin( )
- Arcsine (inverse trigonometric function)
- acos( )
- Arccosine (inverse trigonometric function)
- atan( )
- Arctangent (inverse trigonometric function)
Additionally, many other mathematical functions are supported. For a complete list and details, refer to the VCSSL Math Library documentation.
Author of This Article
Fumihiro Matsui
[ Founder of RINEARN, Doctor of Science (Physics), Applied Info Tech Engineer ]
Develops VCSSL, RINEARN Graph 3D and more. Also writes guides and articles.
Translation Cooperator
ChatGPT AIs
[ GPT-3.5, 4, 5, 5.1 ]
We greatly appreciate the cooperation of ChatGPT AIs in translating this article.