There are several methods available for launching RINEARN Graph 2D and plotting graphs. Please choose the method that best suits your needs and environment.
The distribution file of RINEARN Graph 2D you downloaded is in a compressed ZIP format. First, right-click on the ZIP file and select "Extract All" or "Extract Here" to unzip it. This will create a folder with the same name as the original ZIP file, containing its contents. From here on, use the files inside this folder. The original ZIP file is no longer needed.
If an error such as "This may cause problems..." prevents you from completing the extraction, right-click on the ZIP file, select "Properties," and then check the "Unblock" box under the Security section at the bottom of the Properties window. Click "OK," and you should be able to extract the file successfully afterward. This error occurs due to the operating system's security features, which are designed to prevent the execution of programs downloaded from the internet because they may be potentially unsafe.
When using Linux or similar systems, the file names in the extracted files may sometimes appear garbled. In this case, try extracting the ZIP file using the unzip command in a terminal as follows:
If this doesn't work, consider using other extraction software or try repairing the garbled file names after extraction using a tool like 'convmv' (the file names are encoded in CP932).
Once you've extracted the ZIP file, let's try launching RINEARN Graph 2D using the simplest method!
If you are using Windows®, simply double-click the "RinearnGraph2D_?.?.?.bat" (batch file, where "?" represents the version number) located in the extracted folder to launch the software. During the first launch, you will be asked a few setup questions, and after answering them, RINEARN Graph 2D will start. From the second time onwards, the software will launch immediately.
If you want to open specific file types in RINEARN Graph 2D by double-clicking them, right-click the file, select "Open with," and specify the batch file mentioned above.
If you are using Linux or another OS, you can launch the software by entering the following in a terminal from the extracted folder:
If necessary, you can specify the amount of memory to use by adding the "-Xmx" option to the java command (e.g., to use 2GB: java -Xmx2g -jar RinearnGraph2D.jar).
If you receive an error indicating that the java command is unavailable, you will need to install a Java™ Runtime Environment (JRE). On systems where the apt command is available, you can check the list of available packages by running:
Based on the list, you may be able to install a JRE by running a command like the following (depending on your environment):
Other versions may also work, but some may not be compatible with RINEARN Graph 2D (* Be sure not to install any packages with "-headless" at the end, as RINEARN Graph 2D does not work with these versions).
Let's put off the advanced launch settings for now and try plotting a file!
After launching the software, select "File" > "Open File" from the menu bar, then choose the file you want to plot.
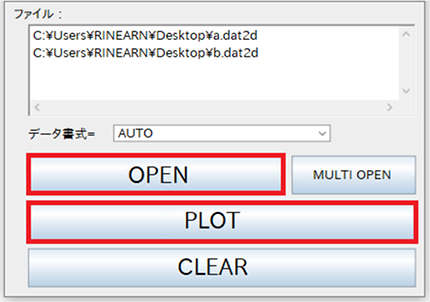
When you select a file with the "OPEN" button, it will be added to the text area above (several sample files are included in the "SampleDataFile" folder within the downloaded package). After adding all the files you want to plot, click the "PLOT" button to render them on the graph.
(* If you want to directly plot data from spreadsheet software instead of opening a file, simply select and copy the data in the spreadsheet, right-click on the graph screen, and choose "Paste Data".)
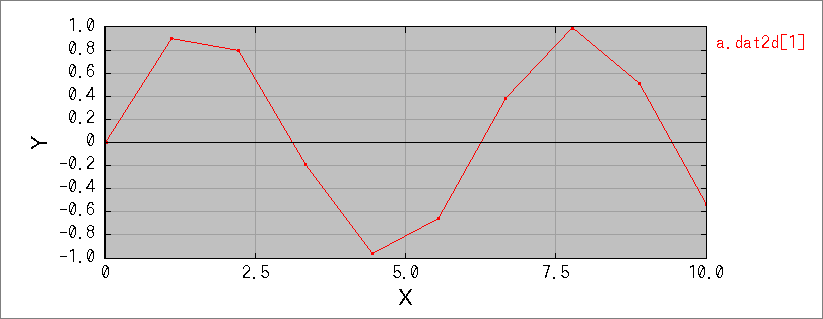
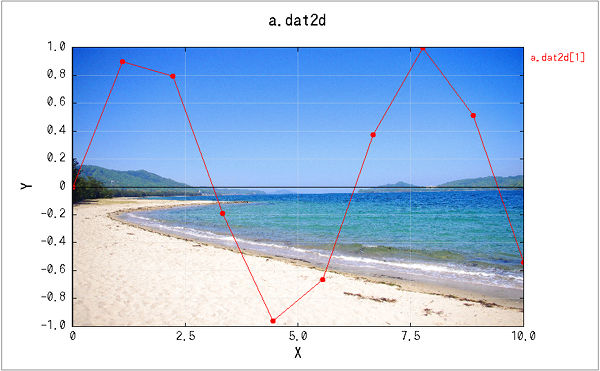
The figure below shows an example of plotting a single file. For a simple (single-series) file, red points are plotted at each coordinate and connected by lines, as shown. If you don't want to connect the points with lines, uncheck the "With Lines" option from the "Options" menu in the menu bar. Similarly, if you don't want to display points, uncheck the "With Points" option.
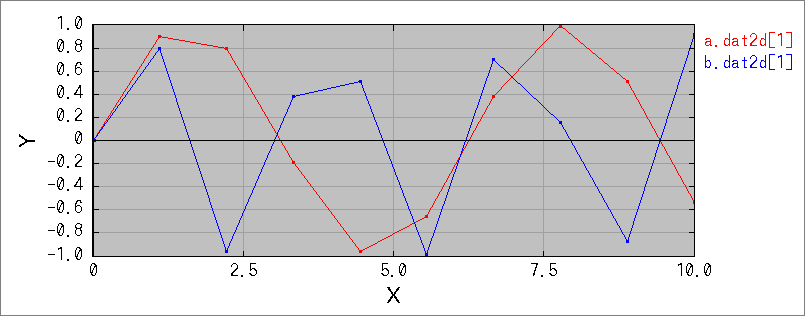
When you select and plot multiple files, each file is treated as a different data series, and each data series is plotted in a different color. The figure below shows an example of plotting two files. It is also possible to include multiple series within a single file. For more details, please refer to the explanation in Data File Format.
For multi-data-series graphs, you can also animate the plot by treating the data series numbers as time steps. You can access the animation mode from the menu bar by selecting "Tools" > "Animation."
Depending on the size of the file you're plotting, you may run out of allocated memory, causing a "Memory Error" message to appear and the software to close.
If this happens while using Microsoft Windows, double-click the "SetMemorySize.bat" (batch file) and set the memory size to a larger value.
If you are using Linux or another OS, follow the steps mentioned in the Simple Launch Methods section by adding the -Xmx option to the java command. However, if you have set up the path and are using the ring2d command, open the "ring2d" file (without an extension) in the "bin" folder of the RINEARN Graph 2D directory using a text editor, and add the -Xmx option to the java command inside the file.
If you want to regularly use RINEARN Graph 2D from a command prompt or shell, you can set the path to the "bin" folder, located within the folder where you extracted RINEARN Graph 2D, in the environment variable Path (or PATH). After doing this, you can use the 'ring2d' command, and by simply entering:
RINEARN Graph 2D will launch and plot the file "a.dat2d." You can also plot multiple files by separating them with spaces:
First, place the RINEARN Graph 2D folder in a suitable location (this is where you will keep it). Then, follow the steps to set the path. The method may vary depending on your version of Windows, so for detailed instructions, search for "Windows Path Setting."
For reference, if you are using Windows 10 or 11, the steps are as follows:
Be careful not to accidentally modify or delete other values, as this can cause serious problems. (You can also register it in the system environment variables, but in this example, we are registering it in the user environment variables for safety). If possible, it's safer to ask someone familiar with these procedures to help you.
First, place the RINEARN Graph 2D directory in a suitable location (this is where you will keep it). For example, let's assume you place it in the following location:
Next, use the cd command to navigate into the "bin" directory within this location and execute the following command:
Finally, open the .bashrc (hidden file) or .bash_profile or .profile in your home directory (which file is active depends on your operating system) using a text editor, and add the following line at the end:
Adjust the content after $PATH: to match the location where you placed the RINEARN Graph 2D directory. Also, depending on your shell or best practices, you may or may not need to enclose the right-hand side in double quotes.
When drawing a graph in RINEARN Graph 2D, depending on your environment, the text and line boundaries in the graph displayed in the window may appear jagged and rough (see the image below for an example).
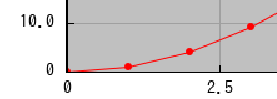
* The image has been enlarged for clarity beyond its actual size on the screen.
This issue may occur if your PC is set to enlarge the display content. For example, if you are using Microsoft Windows, you can check and adjust the display scaling settings by right-clicking on the desktop and selecting "Display Settings."
* Please note that this is not an issue with the OS itself, but rather a result of various factors, including how the software is displayed.
If the display scaling is set to anything other than 100%, the text and lines may appear rough, as shown above. When set to 100%, the quality should look like the image below (this is the intended display quality):
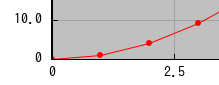
* The image has been enlarged for clarity beyond its actual size on the screen.
However, the roughness only affects the appearance on the PC screen and does not impact the quality of the graph when saving the image to a file or copying it via right-click (the image quality will be the same as at 100% scaling). Therefore, unless the roughness makes it difficult to work with, there's no need to force the display scaling to 100%.
RINEARN Graph 2D includes a "Wallpaper Mode" that allows you to display an image file in the background.
In any of the aforementioned launch methods, if you place a JPEG image file named "RinearnGraph2DScreen" (full name including the extension: "RinearnGraph2DScreen.jpg") in the root directory of the RINEARN Graph 2D folder (the same location as "RinearnGraph2D.jar"), the image will be automatically loaded and displayed as the wallpaper when the software starts.
Originally, the wallpaper mode was designed to improve comfort during long work sessions, but it can also be useful if you want to overlay explanatory text, arrows, or reference lines on the graph background. Additionally, you can use an image of another graph as the background and overlay the contents of a coordinate data file on top of it (* you'll need to remove any margins or unnecessary areas beforehand).