Graph Window and User Interface
This section explains the design of the RINEARN Graph 2D window and how to operate each UI component.
How to Operate Each Component in the Window
First, let's go over the components arranged in the window.
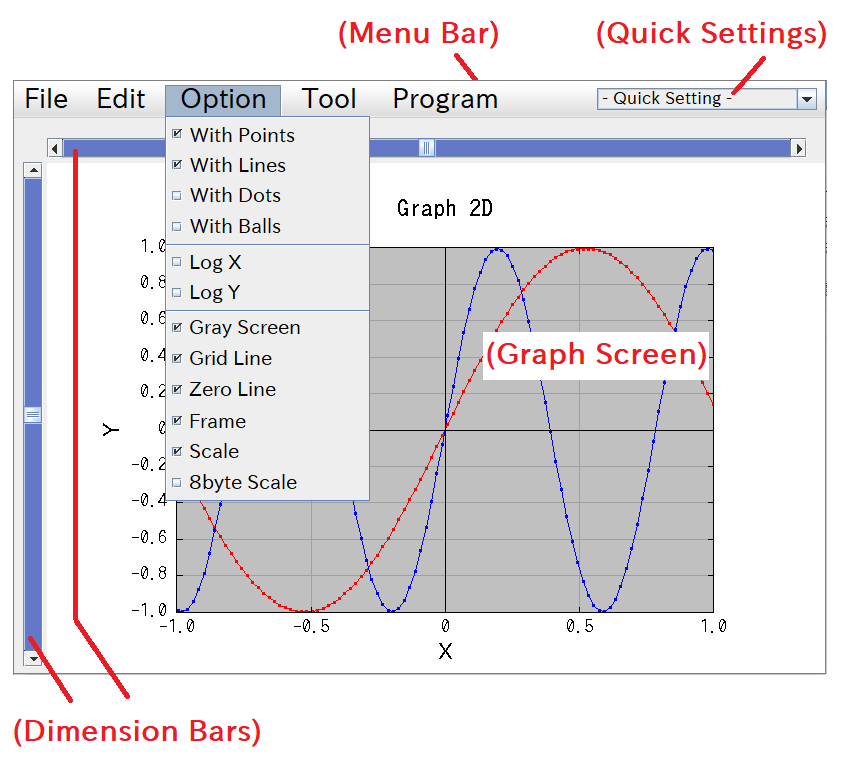
Menu Bar
From the menu bar at the top of the window, you can open coordinate data files, specify plot options, and perform various other settings. For more details, refer to the next section: Menus.
Dimension Bars
The two scroll bars along the top and left edges of the screen, dimension bars, allow you to independently zoom in and out of the plot range in the X and Y directions.
The dimension bars respond very sensitively (exponentially), so please handle them carefully.
Quick Settings Selector
The quick settings selector at the top-right of the screen allows you to quickly switch between different settings. You can add new settings by selecting "Add new Setting" from the selector. Added setting file are saved in the "RinearnGraph2DQuickSetting" folder, so if you want to carry them over after a version update, please copy them manually.
Graph Screen
The graph is drawn on the central graph screen. In this area, you can use mouse operations to change the drawing range, zoom in/out, and more. A crosshair cursor and the coordinate values at the cursor's position are displayed beneath the mouse pointer.
Mouse Operations on the Graph Screen
Below are explanations of the mouse operations available on the graph screen.
Left Drag
Dragging with the left mouse button selects a range on the graph, and the selected range is re-plotted to fill the entire screen, similar to other graphing software. The re-plotting occurs in the same window, not a new one.
Right Drag
Dragging with the right mouse button allows you to move the plot range horizontally and vertically, as if grabbing and shifting the graph.
Left Click / Double Click
A single left click re-plots the graph with approximately 1.7x magnification, centered on the clicked point. A double-click, on the other hand, re-plots the graph at roughly 1/1.7 magnification, zooming out.
Right Click
Right-clicking opens a menu where you can perform actions such as copy and paste.
Scroll Wheel
Scrolling with the mouse wheel allows you to continuously zoom in and out, offering finer control than left-clicking or double-clicking.
Author of This Article
Fumihiro Matsui
[ Founder of RINEARN, Doctor of Science (Physics), Applied Info Tech Engineer ]
Develops VCSSL, RINEARN Graph 3D and more. Also writes guides and articles.
Translation Cooperator
ChatGPT AIs
[ GPT-3.5, 4, 5, 5.1 ]
We greatly appreciate the cooperation of ChatGPT AIs in translating this article.