Here, let's download RINEARN Graph 3D, start it up, and try plotting a graph!
There are several different methods depending on your environment and preferred usage (either in GUI or via command line). Please choose the method that suits you best and give it a try.
First, let's download RINEARN Graph 3D! You can download it for free anytime from the official website or by clicking the button below:
When you click the button above, you will be asked whether you want to save a ZIP file with the following name. Please save it to somewhere in your PC:
Please note that directly opening the ZIP file without saving it first may allow you to see its contents, but proceeding without properly extracting it can lead to errors later on. It's important to save the file to your PC first, and then follow the steps to properly extract (unzip) it before using the application.
A ZIP file is a compressed archive that contains multiple files and folders packed into a single file. While you can double-click to view its contents, this is merely for "temporary inspection." Before using the app properly, you need to extract (unzip) its contents. Using the contents of the ZIP file without extracting them can lead to various errors and issues.
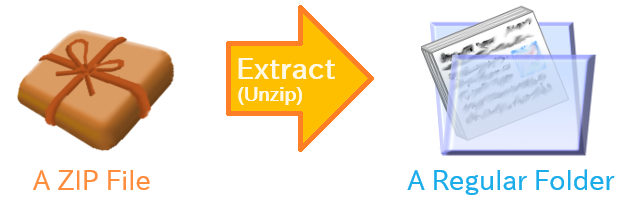
So, let's proceed to extract the ZIP file "rinearn_graph_3d_?_?_?.zip" that we downloaded and saved earlier!
However, this step, seemingly simple, has a few pitfalls. Depending on your environment, the procedure differs, so please read the instructions below based on your operating system: For Windows Users | For Linux and Other OS Users |
If you are using Windows, please follow these steps to ensure proper extraction of the downloaded ZIP file.
First, right-click on the ZIP file that you downloaded and saved earlier, and open "Properties."
Then, in the security section at the bottom of the properties window, check the box that says "Allow" and click "OK."
Next, right-click on the ZIP file again and select the option "Extract All ..." from the menu.
Once the extraction is successful, a regular folder with the following name will be created:
This folder contains everything composing RINEARN Graph 3D, so please copy and place it somewhere convenient for use. The original ZIP file is no longer needed.
In Linux and other operating systems, you can typically extract (unzip) the file "rinearn_graph_3d_?_?_?.zip" by right-clicking on it and selecting the appropriate option from the menu. If the extraction process completes without any issues, then you're all set.
However, depending on the environment, the names of the files within the extracted folder might appear garbled. If that happens, try extracting the file using the 'unzip' command from a command-line terminal as follows:
If this doesn't resolve the issue, you may consider using a different extraction tool or attempting to repair the garbled filenames after extraction using commands like 'convmv.'
Now, let's finally start up RINEARN Graph 3D!
While you can start RINEARN Graph 3D via command line, let's begin by launching it with a double-click like a regular application.
First, open the folder "rinearn_graph_3d_?_?_?" resulting from unzipping the ZIP file earlier. Inside, you should find a file named:
This is the file used for launching, so please double-click it with your mouse. RINEARN Graph 3D will then start up.
The first time you start RINEARN Graph 3D after downloading, a black screen with white text will appear, indicating the progress of environment setup (preparing the necessary environment for the application to run).
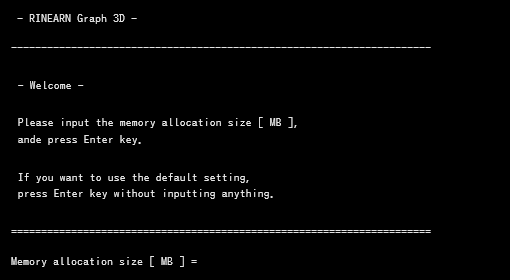
You may be prompted for input at certain points, but unless there are specific reasons not to, you can generally complete this process by pressing the Enter key (YES).
After completing the environment setup, RINEARN Graph 3D will start and its window will launch as shown below. From the second launch onwards, the environment setup will be skipped, and the application will start immediately.
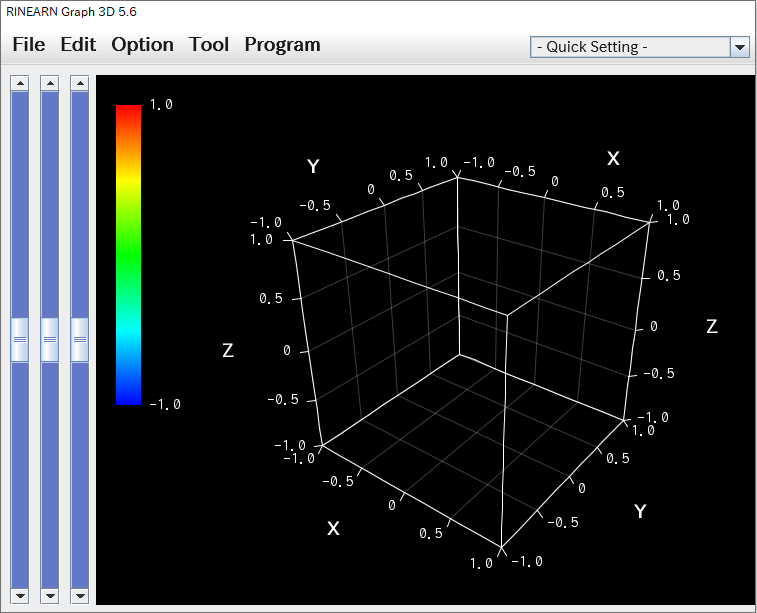
Typically, you interact with this window's interface using your mouse, opening data files and plotting graphs. This is actually covered in the "Opening Data Files and Plotting Graphs" section later, so if you primarily use this app by mouse, not a command-line, please proceed there.
RINEARN Graph 3D can also be launched and utilized from the command terminal. Especially for users of operating systems other than Windows, this method is the primary way of launching. Even for Windows users, having the option to use it via command can be convenient in some situations.
Please proceed to the setting instructions applicable to your environment: For Windows Users | For Linux and Other OS Users |
If you are using Windows, first place the "rinearn_graph_3d_?_?_?" folder, which contains RINEARN Graph 3D, in a fixed location. For the sake of simplicity in explanation (though it's a bit informal), let's assume you placed it in the following location:
Inside the "rinearn_graph_3d_?_?_?" folder mentioned above, there's a folder named "bin." The location of this folder can be represented in text using an absolute path. You'll need this value shortly.
Next, register the above absolute path in the Windows environment variable "Path (or PATH)." If you're familiar with command-line work, you may not need detailed instructions on how to do this. However, if you're new to this or unfamiliar, please refer to the following article for guidance:
The above article provides a detailed explanation of the steps necessary for using the commands, including setting the path.
Once you've completed the path registration setup, launch a command input terminal such as Command Prompt or PowerShell, and try entering the following:
This will launch the RINEARN Graph 3D window. Not only can you simply start it up, but various command-line options are available as well. For details, either run "ring3d --help" or refer to the article mentioned above.
For Linux and other operating systems, please start by placing the "rinearn_graph_3d_?_?_?" folder, which contains RINEARN Graph 3D, in a fixed location. A typical example would be:
Next, go to the "bin" directory within this location using the cd command, and execute the following command:
Finally, register the absolute path of the "bin" directory, where this file is located, in the environment variable "PATH." The registration setting differs depending on the OS and shell, so please search the web for "how to set PATH [Your OS Name]" to find the method that fits your environment.
For instance, on Ubuntu or similar Linux systems using a bash-compatible shell, open the ".bashrc" (a hidden file), ".bash_profile", or ".profile" file (which one is active varies case by case) located in the user's home directory with a text editor and append the following line to the end:
Once the PATH setup is completed, after re-logging in, running the following command will launch RINEARN Graph 3D (if an error occurs due to a missing environment, it will be mentioned shortly after):
Not only does this launch the application, but various command-line options are also available. For more details, either run "ring3d --help" or refer to the following article:
When executing the above command, if you encounter errors indicating the absence of the environment for running Java programs, you'll need to install the environment separately. The most reliable way is to install the OpenJDK, an open-source development environment for Java. The following "Eclipse Temurin", a destributuion of OpenJDK, can be installed relatively easily:
Alternatively, if you can obtain just the Java runtime environment via apt or similar package managers, you can run this app with that. However, please note that it won't work if you install the headless version (without a GUI environment).
Also, for optimal performance and compatibility, it's recommended to install the latest LTS (or later) version of Java, as RINEARN Graph 3D is compatible with it.
Congratulations! You've completed all the preparations to use RINEARN Graph 3D. Great job getting here!
Now, let's try using it for real. We'll open a sample data file and plot it on a 3D graph.
First, launch RINEARN Graph 3D, then from the menu bar, select "File" > "Open File" and choose the file you want to plot.
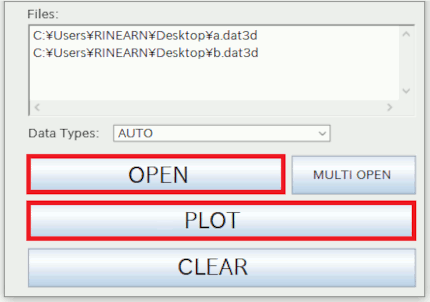
Once you select a file with the "OPEN" button, it will be added to the text area above the button. After adding all the files you want to plot, press the "PLOT" button to plot them on the graph.
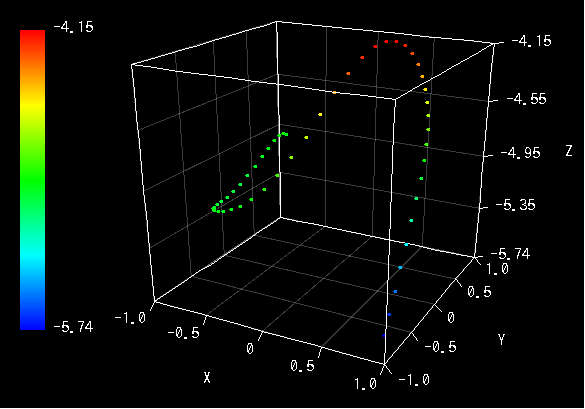
The following image shows an example of plotting a single file. By default, points are plotted at the positions of each coordinate contained in the file. The color of these points varies in gradient according to the Z-values of the coordinates (as explained later, you can also disable this and use a single color).
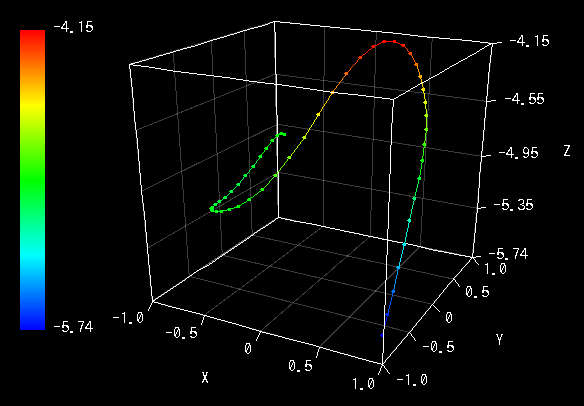
If you check "Line Plot" in the "Option" menu from the menu bar, each point will be connected with lines, as shown in the image below.
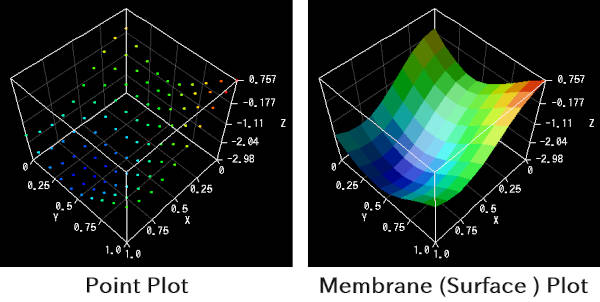
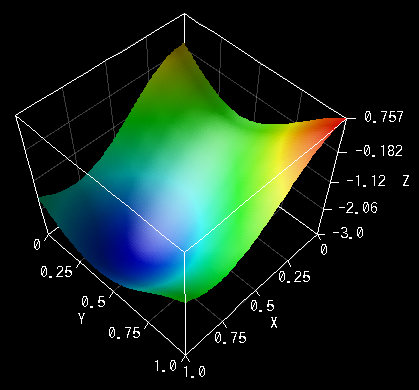
If the data is compatible with mesh format (see the "Data File Formats" page for details), selecting "Option" > "Membrane Plot" (*) draws a membrane (surface) by connecting each four neighboring coordinates as a quadrangle, as depicted on the right side of the image below. The Sample folder mentioned earlier also includes sample files for surface plotting.
When plotting multiple files, as depicted on the left side of the image below, the data from all files will be plotted together. The data from each file is internally distinguished as different series, allowing for color-coding. Unchecking "Gradient (Z Value)" in "Option" menu will result in color-coding as shown on the right side of the image below.
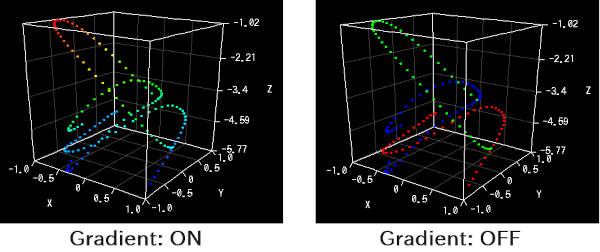
Moreover, if a single file contains multiple series of data (refer to the "Data File Formats" page), disabling the gradient will also result in color-coding by series.
When drawing graphs with RINEARN Graph 3D, depending on your environment, you may notice that the edges of text and lines on the graph displayed within the window appear jagged and rough (Example: see below image).
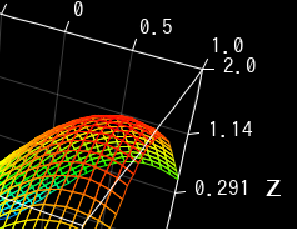
This can occur when your PC is set to display content enlarged on the screen. On Windows, you can check or adjust the scale setting (zoom level) by right-clicking on the desktop and selecting "Display Settings."
Note: This phenomenon is not due to any issues with the OS's functionality itself but may arise due to various reasons including software factors.
If the display scale is set to anything other than 100%, text and line boundaries may appear rough as shown above. The image quality when set to 100% scale is as shown below (this is the original quality).
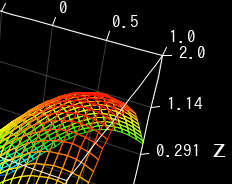
However, the degradation in image quality only affects the appearance on the window and has no impact on the quality when saving the graph image to a file or copying it via right-click (the quality remains the same as at 100% scale). Therefore, unless the appearance is so bothersome that it hampers your work, there's no need to force your display scale to 100%.