
We are pleased to announce the release of the latest version of the Vnano script engine, Ver.1.1. In this article, we'll introduce the improvements made over the previous version.
What exactly is Vnano? It's an engine that can be embedded within applications to execute calculations and scripts. For instance, it can be used for calculating expressions in a scientific calculator software.
Vnano will also be utilized in the next major version of RINEARN Graph 3D. It will be employed to plot mathematical formulas, involving the repetitive execution of the same expressions. We will delve into the specific process of formula plotting and discuss why the speed of the script engine plays a critical role in this process.
In this version, we've made significant enhancements in processing speed by reducing the overhead of handling requests. We'll provide a comparison of old and new speeds with 10,000 requests in RINEARN Graph 3D and on a benchmark code with billions of requests.
Let's start by briefly introducing what Vnano actually is.
Vnano is a compact processing engine (script engine) that can be embedded within applications to execute calculations and scripts. Linguistically, it's a subset (a reduced-functionality version) of the language VCSSL.
One of the simplest and most straightforward examples of using Vnano is the scientific calculator software RINPn, released last year. In RINPn, users can freely input and calculate long mathematical expressions.
Furthermore, RINPn allows users to call various functions from within these mathematical expressions, and these functions can also be custom-made by the users. Specifically, users can write scripts using a C-like syntax to define functions (and variables) as follows:
In RINPn, the processing of such mathematical expressions and the interpretation and execution of scripts are handled by the Vnano script engine.
Besides calculator software, there are often situations where you want to process user-inputted formulas within an app or allow users to write scripts for automation. Implementing such processing engine from scratch can be quite challenging, but embedding Vnano makes it easy to realize these functionalities. Please note that this assumes the app is Java-based.
As previously announced, the next major version of the 3D graphing software RINEARN Graph 3D, Ver.6, will also incorporate Vnano internally.
One of the key roles of Vnano within RINEARN Graph 3D is math-expression plotting, which means creating graphs from mathematical expressions. Here's an example of a graph created using the next major version of RINEARN Graph 3D in development:
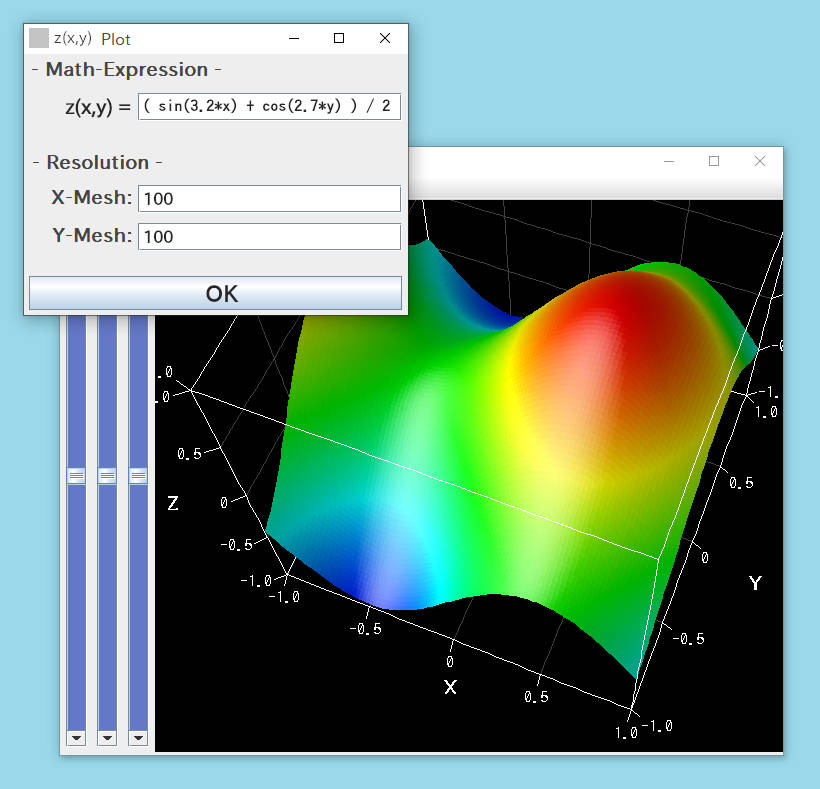
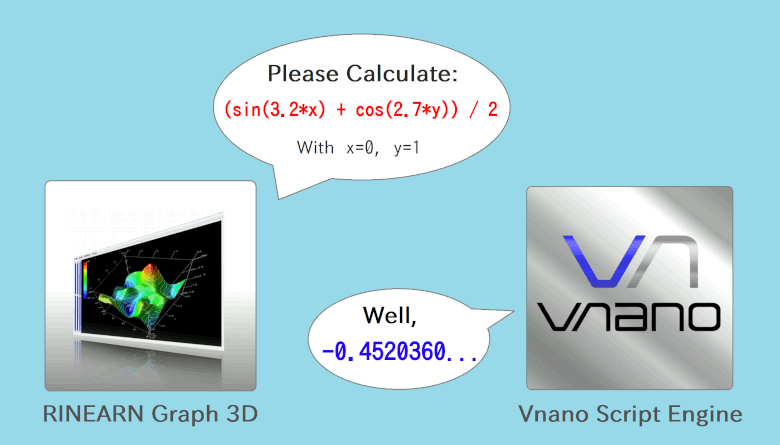
The above image shows a 3D surface graph of the following mathematical expression in xyz space:
\[ z = \frac{\sin(3.2 x) + \cos(2.7 y)}{2} \]
When plotting graphs of such mathematical expressions, the internal processing involves calculating what value "z" takes at each intersection point (grid point) on a finely divided mesh in both the x and y directions.
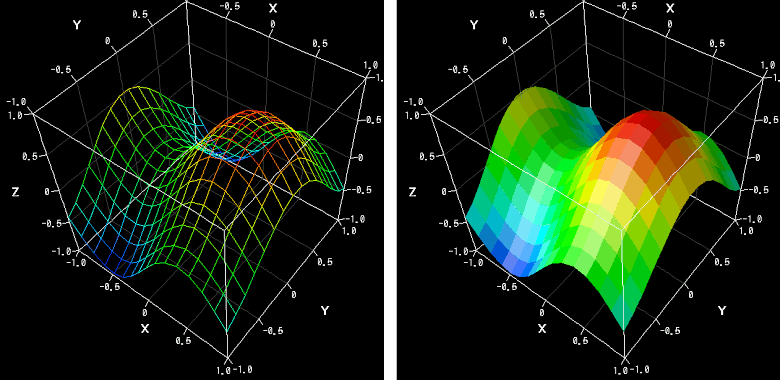
For clarity, here's a representation of a coarser mesh:
The left image in the figure above shows the mesh itself, and the right one shows it connected by surfaces.
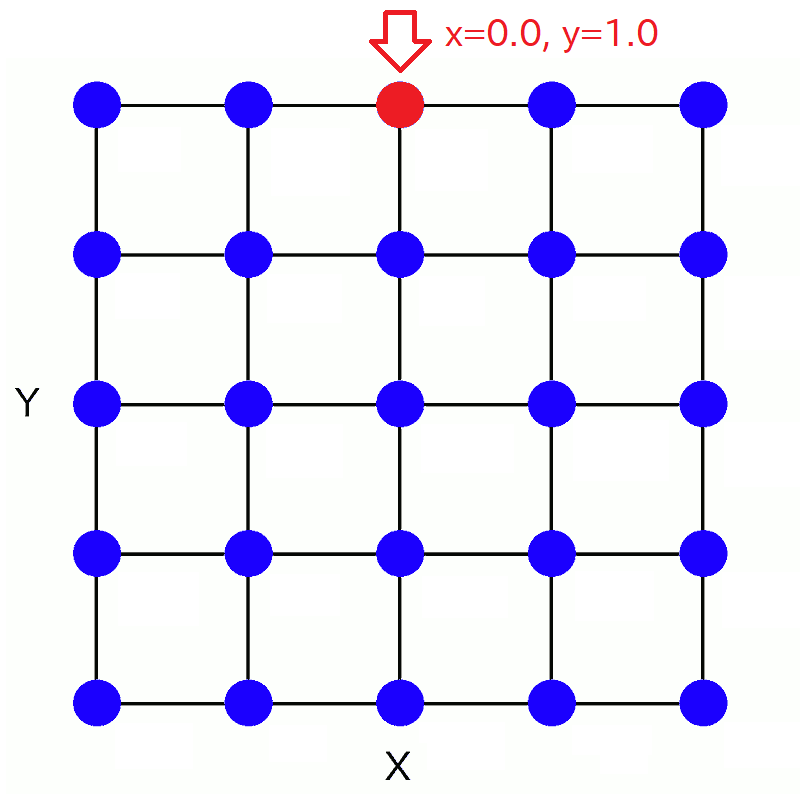
This mesh forms a grid pattern on the X-Y plane. Let's focus on a certain intersection point, for example, at the position (x,y) = (0.0, 1.0).
Once we know the z-value at this point, the position of this point in three-dimensional space is determined.
To determine the z-value, we need to calculate the right-hand side of the earlier mathematical expression:
with x = 0.0 and y = 1.0.
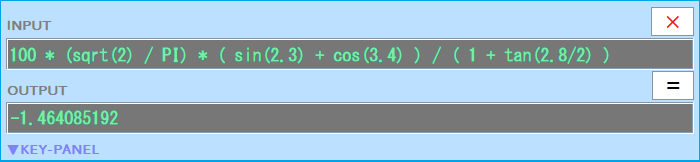
You could calculate this with a scientific calculator.
In fact, if you calculate it now, you'll get the result z = -0.4520360....
Thus, the 3D coordinates of this point are (x,y,z) = (0.0, 1.0, -0.452...).
Instead of using a scientific calculator,
RINEARN Graph 3D employs Vnano script engine to handle such calculations internally.
In this manner, the z-values for all other intersection points on the mesh (where the values of x and y vary) are calculated from the mathematical expression.
As a result, the overall shape of the mesh in 3D space is determined, and finally, the graph can be plotted.
Now, in apps like these, the script engine repeatedly receives a large number of calculation requests from the app side (in this case, RINEARN Graph 3D).
For instance,
Even if one calculation request takes just 1 millisecond (1/1000th of a second), it would still take a total of 10 seconds.
That would be a bit too long for waiting for a math-expression plot.
Therefore, in these scenarios, the "speed" of the script engine becomes extremely crucial.
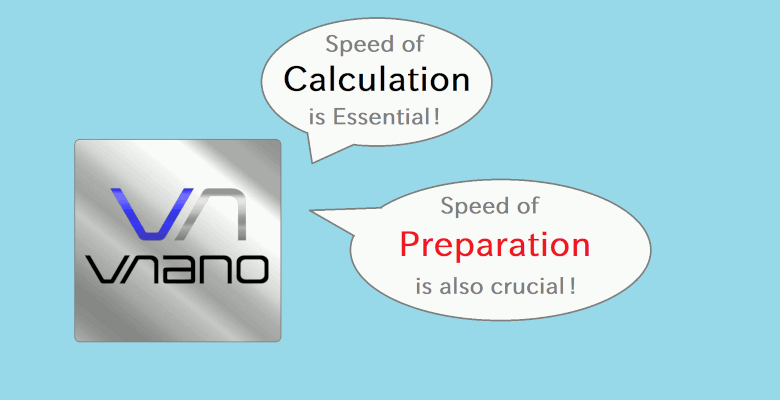
And it's not just about the speed of the calculation process itself.
The total time it takes from when the application requests the script engine to process, then prepares, performs calculations, and finally cleans up, all contribute to the perceived speed.
That's because, no matter how fast the actual calculation is, if it takes a long time to prepare for calculation after receiving the request, the overall experience feels slow, especially in cases where a large number of requests are generated.
Now, let's dive to the main topic of this update. The update of the Vnano script engine in this release reflects the speed improvements made for its incorporation into the upcoming version of RINEARN Graph 3D.
The speed improvement in this release is not about the calculation speed itself.
The calculation speed of Vnano is already sufficiently fast (around 1 GFLOPS for double-precision scalar operations, and several tens of GFLOPS for array operations), and it hardly hinders the internal processing of the graph software.
So, what has been sped up? It's the "preparation time" from receiving a calculation request to actually starting the calculation.
As mentioned earlier, we've trimmed this down, and it becomes highly effective when dealing with continuous and massive calculation requests.
This speed improvement is particularly noticeable in situations where the same calculation expressions or scripts are repeatedly inputted.
This is exactly what happens in math-expression plotting in RINEARN Graph 3D, as we saw earlier.
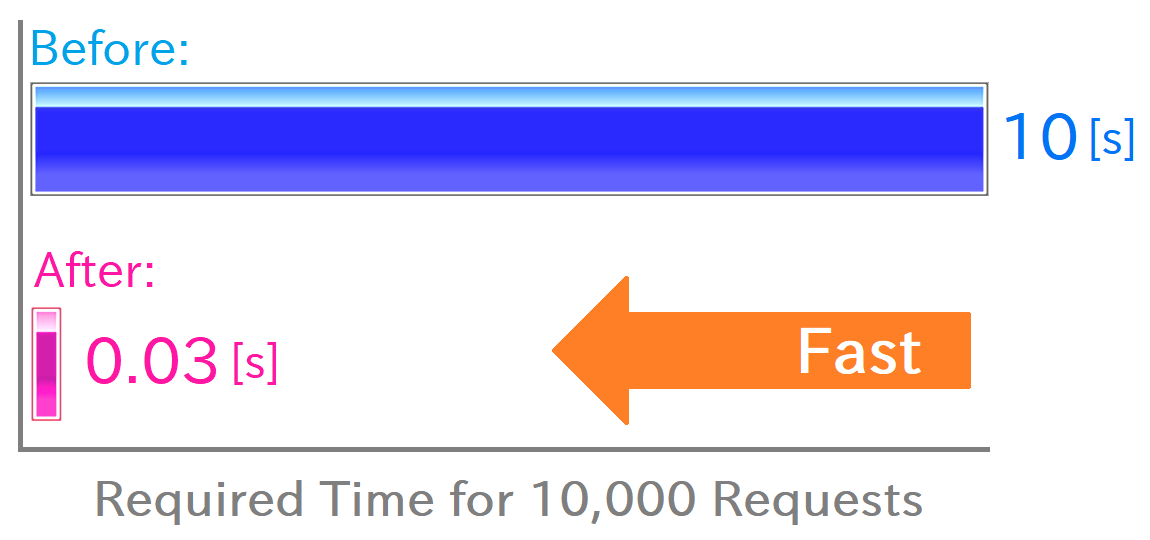
For instance, in the previous version, calculations for a 100 x 100 mesh (10,000 requests) took around 10 seconds.
With this update, it has been dramatically reduced to a matter of hundredths of a second (e.g., 0.03 seconds).
This represents an improvement of several hundred times in speed: a pace handling roughly hundreds of thousands of requests per second.
As we'll see shortly, under more idealized conditions to measure maximum performance, it seems that even faster processing is potentially achievable.
However, the maximum performance exhibited under extreme conditions, which are rarely encountered in practical scenarios, may not be a useful reference.
In contrast, the results presented here, obtained from regular usage scenarios, serve as a reliable benchmark for real-world applications.
Now, let's consider the results under more idealized conditions aimed at measuring maximum performance.
Specifically, we wrote a highly simplified, "benchmark-only code" that merely keeps sending simple calculation requests to the script engine repeatedly.
Then we measured its performance. This was necessary because in real-world applications, various complexities tend to interfere with measuring the pure performance of the script engine.
Furthermore, we varied the number of processing requests to explore the range where maximum performance is achieved.
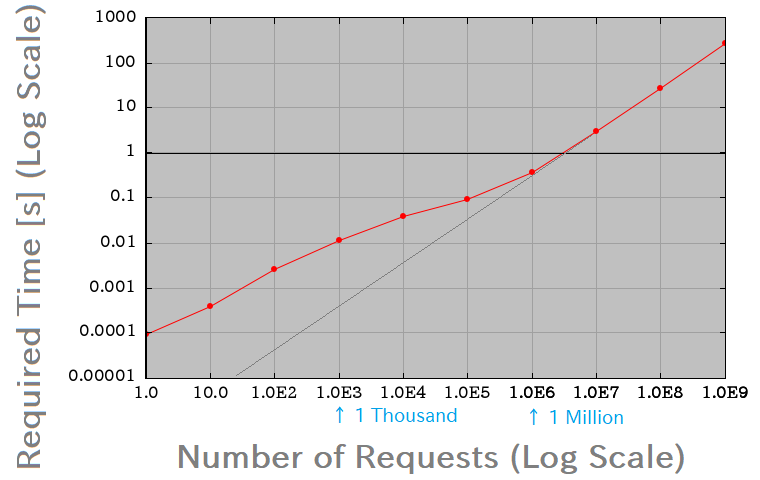
The results are first illustrated in the graph below, showing the relationship between the number of requests and the time required to process them.
Note that to activate the speed improvement mechanism, an extra processing step is executed once at the beginning, but this is not included in the required time in the graph.
Thus, the required time in the graph represents the "required time under the full effect of the speed improvement".
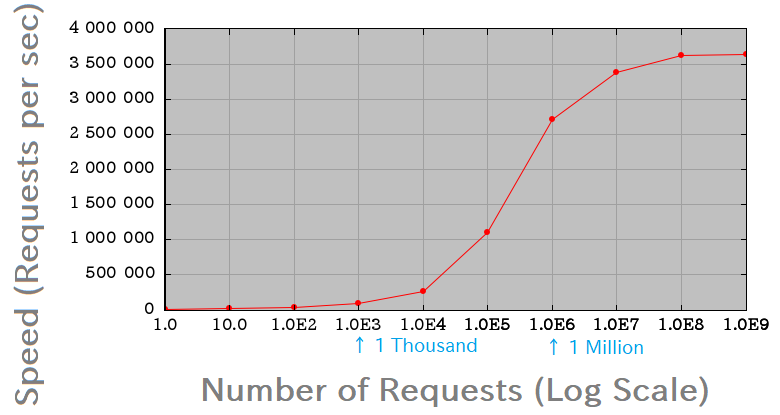
As shown in the above graph, in the region where the number of requests exceeds around 10^6 (one million), the graph follows a linear trend.
The slope of this linear trend is almost 1, and since this graph is on a logarithmic scale on both axes, it implies that "the required time is approximately proportional to the number of requests."
This is a straightforward behavior we expected.
Next, we calculated "the number of requests processed per unit time," or in other words, "the processing speed," by dividing the number of requests by the corresponding required time.
It is plotted in the following graph:
If you liken the above curve to a car engine performance, it seems like "the power band starts above one million revolutions".
On the flip side, in the low load region, such as the common range of 10,000 requests, the speed isn’t much to speak of, giving off an "still idling" vibe.
In one word, this performance curve has a "poor drivability", to utilize maximum processing speed in practical purposes.
So, these are the results of the speed improvement in this update.
When we compare the results A and B, one point of concern remains:
"In the common usage range on RINEARN Graph 3D, the performance achieved is only about 10% of the maximum limit reached in the benchmark testing (with 100 million requests)."
Although 10% speed should be sufficient for typical use cases so isn't a severe problem, it might be one of the future challenges for Vnano to unlock more performance in practical scenarios.
----
In conclusion, this article has presented the details and results of the speed improvement with a user-oriented perspective in line with the release of Vnano's latest version, Ver. 1.1.
Actually, this article is planned to have a sequel, and in the next installment, we plan to delve deeper into the specifics of the speed improvements implemented within the script engine from a developer's perspective. Stay tuned for details in the next installment!
Speed of Calculation is Essential, but the Speed of "Preparation After Requesting a Calculation" is Also Crucial

Speed Improvement in this Update
What the Speed Improvement Entails - Reducing the "Preparation Time" for Handling Calculation Requests
 Conversely, this speed improvement is less effective in cases where the input varies with each request.
Result of the Speed Improvement A:
An Example with 100 x 100 Mesh Calculation (10,000 Requests) in RINEARN Graph 3D
Results of Speed Improvement B:
Under More Idealized Conditions
 Comment: Is it just that modern CPUs require a certain level of workload to kick into high gear? Or could it be JVM-related or some other factor? Hmm...
Future Challenges
Author of This Article
 Fumihiro Matsui
[ Founder of RINEARN, Doctor of Science (Physics), Applied Info Tech Engineer ]
Develops VCSSL, RINEARN Graph 3D and more. Also writes guides and articles.
Translation Cooperator
 ChatGPT AIs
[ GPT-3.5, 4, 5, 5.1 ]
We greatly appreciate the cooperation of ChatGPT AIs in translating this article.