


RINEARN Graph 3D
RINEARN Graph 3D is a free 3D graphing software compatible with various operating systems and does not require installation. It allows users to easily create 3D graphs from files generated in spreadsheet software or numerical computing programs.
Available on Various PC Operating Systems! - Also Supports Command-Line Use
RINEARN Graph 3D, written in the Java™ language, is compatible with various PC operating systems such as Microsoft® Windows® and Linux (not compatible with smartphones). It can be used without installation, making it ideal for both regular and portable use on USB memory devices.
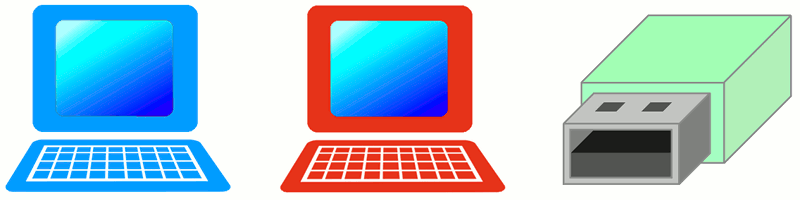
Additionally, it supports command-line operations using the "ring3d" command as needed.
» For detailed instructions on launching and command-line settings, click here!
Easy Graph Creation from Spreadsheets
With RINEARN Graph 3D, you can effortlessly create graphs not only from files but also directly from data in spreadsheet software such as Microsoft® Excel®!
Specifically, after downloading and launching RINEARN Graph 3D, simply select and copy the data in the spreadsheet software, right-click on the graph screen, choose "Paste Data," and a 3D graph will be rendered.
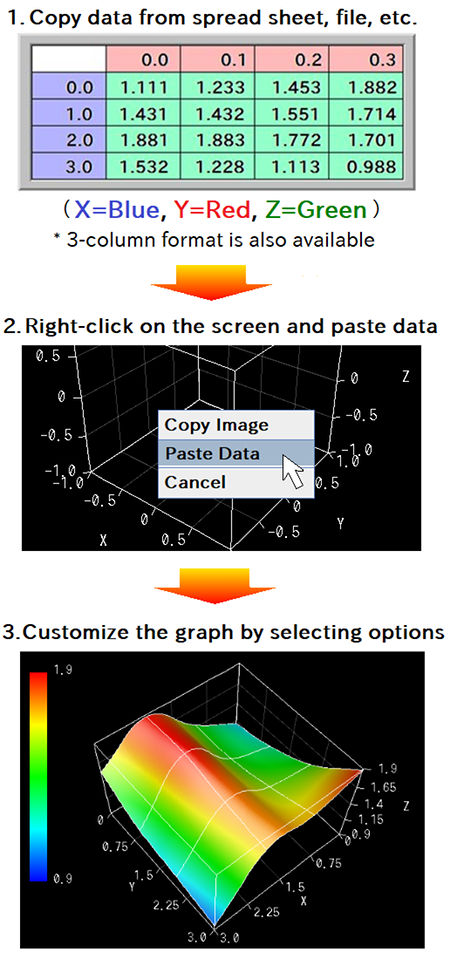
For details on data formatting, please refer to the guidelines on the supported data file formats. If you save the data to a text file, you can open and load it via the "File" menu at the top of the graph screen.
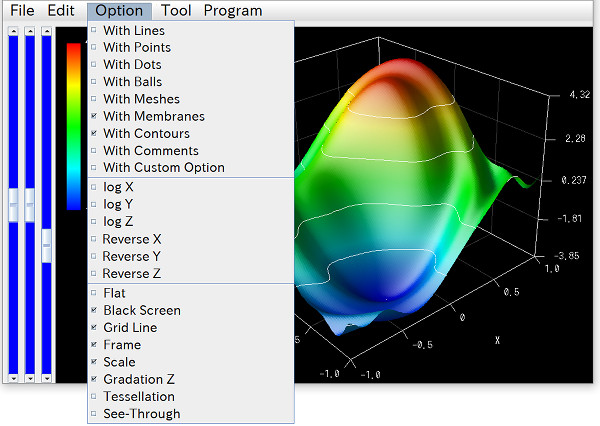
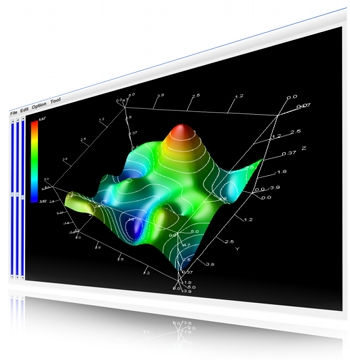
Easy-to-Use Interface
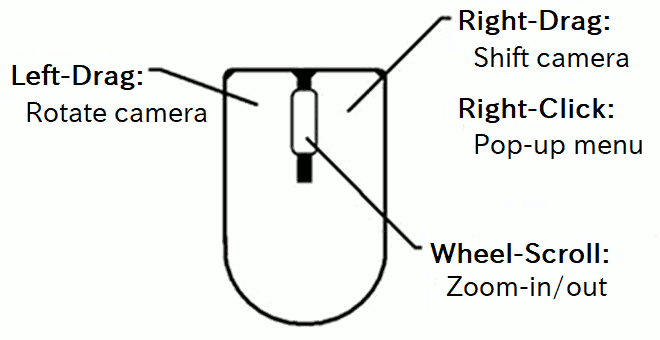
RINEARN Graph 3D features a simple and intuitive user interface centered around a menu bar and mouse operations.
In particular, the algorithm for viewpoint rotation is tailored to viewing 3D graphs and allows for natural-feeling adjustments. We invite you to experience it yourself!
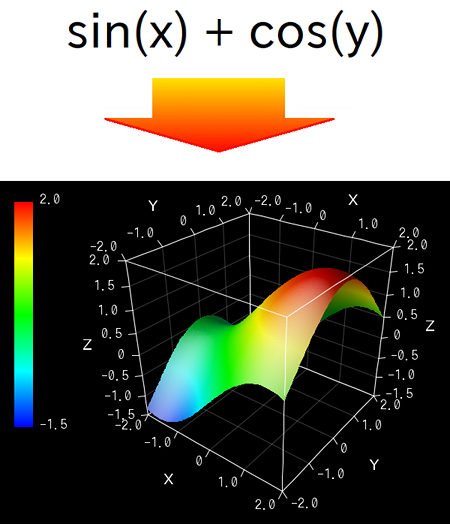
Superior 3D Rendering Engine
RINEARN Graph 3D is equipped with an original, software-rendered 3D engine that ensures consistent graph appearance across different PC hardware configurations. It excels in rendering high-density data, capable of processing hundreds by hundreds of meshes.
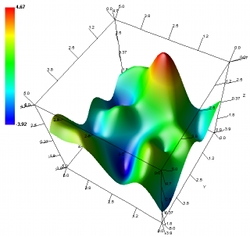
In this 3D rendering engine, we have finely tuned the lighting and shading algorithms to naturally and accurately capture the shapes, roughness, and subtle variations in concavity and convexity of 3D graph surfaces.
Can Interpolate Coarse Data to Smooth Surfaces
RINEARN Graph 3D includes a tessellation function for high-quality surface rendering that interpolates coarse mesh data to produce smooth curved surfaces.
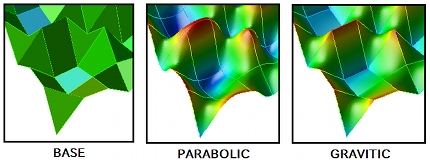
This function is optional and can be toggled on or off as needed (the default is off). When enabled, it maintains the precise positions of the original mesh grid points.
Animation Feature
RINEARN Graph 3D enables users to animate graphs, offering a variety of modes.
For instance, you can treat multiple datasets (either as series or separate files) as different time points, or animate each coordinate point within a single dataset as individual time points. Example animations include gradually drawing lines from start to finish, as depicted in the left figure, or altering the entire shape of the graph as illustrated in the right figure.
Animating multiple series within a single file is straightforward. Simply open the data file as usual, and select "Tools" > "Animation" from the menu bar to easily set up the animation.
Additionally, a tool for loading and animating multiple data files with sequentially numbered names is available under the "Program" menu. This tool not only facilitates continuous animation creation but also supports saving these animations as sequential image files.
Math-Expression Plotting Tool!
RINEARN Graph 3D includes math plotting tools that allow users to graph various types of mathematical expressions.
The math plotting tools are written in the VCSSL scripting language. They can be accessed from the "MathPlot..." items under the "Program" menu. "z(x,y)", "z(x,y,t)", and "x(t),y(t),z(t)" forms are supported.
Controlling and Drawing from Programs
RINEARN Graph 3D can be controlled and utilized as a graph drawing library from programs written in Java or the scripting language VCSSL.
You can automate tasks such as reading data from files, drawing graphs, and saving images. Additionally, RINEARN Graph 3D can be used as a component for data visualization in various software/apps.
- For Java language control methods, click here
- For VCSSL control methods, click here
- Here's an introductory guide to VCSSL programming
Especially, VCSSL is supported as a standard feature for automation scripts within RINEARN Graph, allowing scripts to be executed directly from the "Program" menu without needing a separate development or runtime environment.
The VCSSL official website also offers an extensive array of sample code for controlling RINEARN Graph 3D:
| Plotting files on 3D graphs (points/line graphs) | |
|
|
Sample code for plotting data files on 3D point/line graphs. |
| Plotting files on 3D graphs (surface/mesh graphs) | |
|
|
Sample code for plotting data files on 3D surface/mesh graphs. |
| Plotting arrays on 3D graphs (points/line graphs) | |
|
|
Sample code for plotting coordinate arrays on 3D point/line graphs. |
| Plotting arrays on 3D graphs (surface/mesh graphs) | |
|
|
Sample code for plotting coordinate arrays on 3D surface/mesh graphs. |
| Animating arrays on 3D graphs (points/line graphs) | |
|
|
Sample code for continuously plotting and animating coordinate arrays on 3D point/line graphs. |
| Animating arrays on 3D graphs (surface/mesh graphs) | |
|
|
Sample code for continuously plotting and animating coordinate arrays on 3D surface/mesh graphs. |
Furthermore, from Java, you can also directly access the instructions of the 3D rendering engine , enabling the free drawing of shapes such as points, lines, triangles, and quadrilaterals in 3D space. This feature makes RINEARN Graph 3D an excellent tool for simple 3D drawing tasks in Java programming.
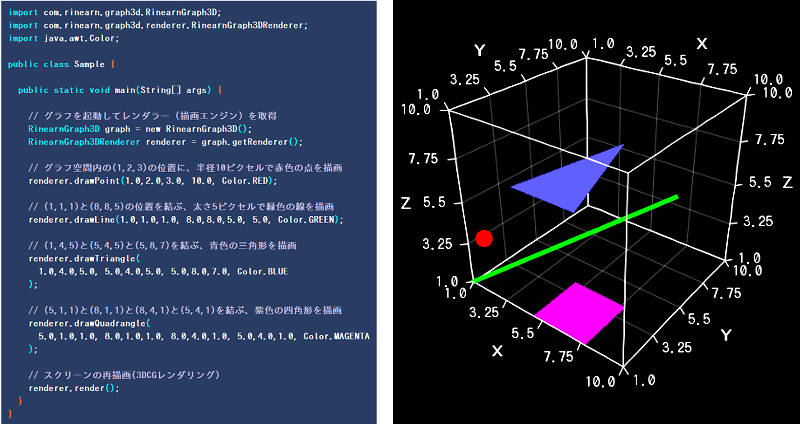
* Note: Direct invocation of rendering engine instructions is currently only supported in Java.
Now, Let's Get Started!
Download the Latest Version of RINEARN Graph 3D
RINEARN Graph 3D is available for free for everyone.

If you are using Windows, simply right-click the downloaded ZIP file, select 'Extract All', and then double-click the "RinearnGraph3D_0_0_0.bat" batch file (where '0' represents version numbers) to start using it immediately.
» For detailed instructions and usage on other operating systems, click here
» Download past versions here
* Please note that past versions have completed their development and maintenance cycles. Unless you have a specific reason, we recommend using the latest version.
- Oracle and Java are registered trademarks of Oracle and/or its affiliates. Other names may be trademarks of their respective owners.
- Microsoft Windows and Microsoft Excel are either trademarks or registered trademarks of Microsoft Corporation in the United States and other countries.
- Linux is a trademark of linus torvalds in the United States and/or other countries.
- Other names may be either a registered trademarks or trademarks of their respective owners.