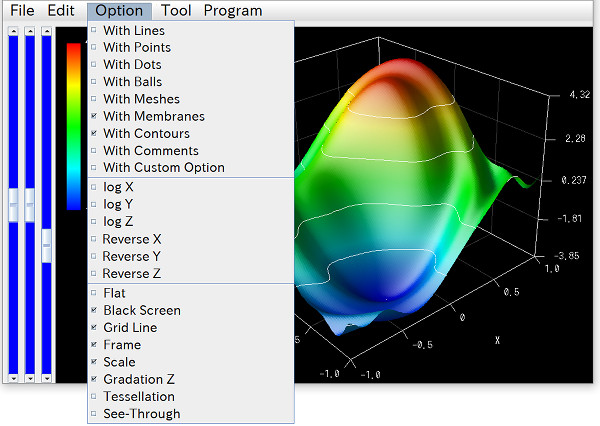
As a first step, let's start by taking a look at what RINEARN Graph 3D is all about!

RINEARN Graph 3D is a 3D graph plotting software suitable for data analysis and visualization purposes. Developed and released by the Japanese software development studio "RINEARN," it is available for download anytime from the official website.
RINEARN Graph 3D supports both Japanese and English, with user guides and other documentation available in both languages. These documents can also be accessed anytime at the above official websites.
RINEARN Graph 3D is free for both commercial and non-commercial use by anyone. The licensing terms have been continuously relaxed, allowing for significant freedom. For example, you can bundle RINEARN Graph 3D with your own data files or programs and redistribute it. Starting from the upcoming Version 6, it will adopt an even more permissive open-source license (MIT License).
RINEARN Graph 3D is developed entirely in Java™, allowing it to run on major PC operating systems (OS).
Officially, it has been tested on Microsoft® Windows® and Ubuntu (a type of Linux). Particularly on Windows, it can be carried on a USB memory device for portable use without the need for installation.

While not officially verified for other OSes, RINEARN Graph 3D can often be run on any system where a Java Runtime Environment (JRE) or Java Development Kit (JDK) is available.
Let's explore some practical applications of RINEARN Graph 3D!
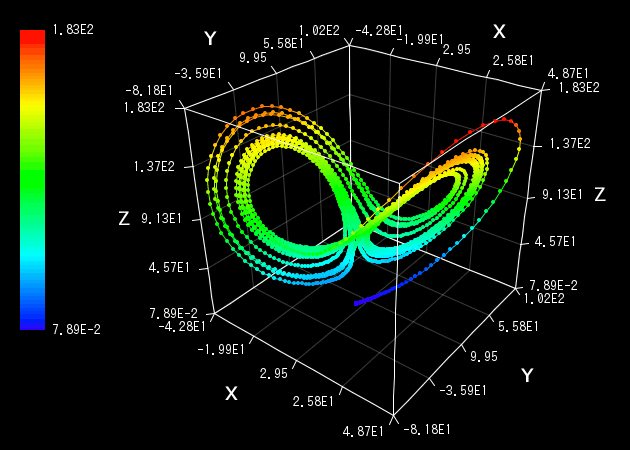
RINEARN Graph 3D was originally developed to visualize 3D coordinates from data files. Such files are commonly encountered in data analysis and numerical computation programming. RINEARN Graph 3D continues to emphasize this use case, making it very convenient for such purposes.
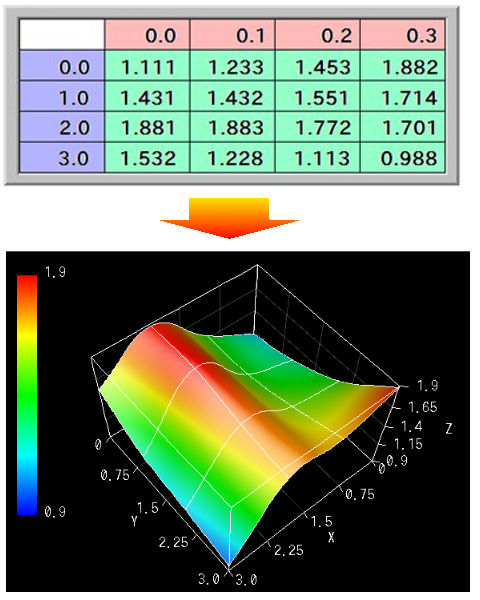
Another common use case is graphing data from spreadsheet software. By copying the data from the spreadsheet and pasting it onto the graph screen, you can easily create 3D graphs.
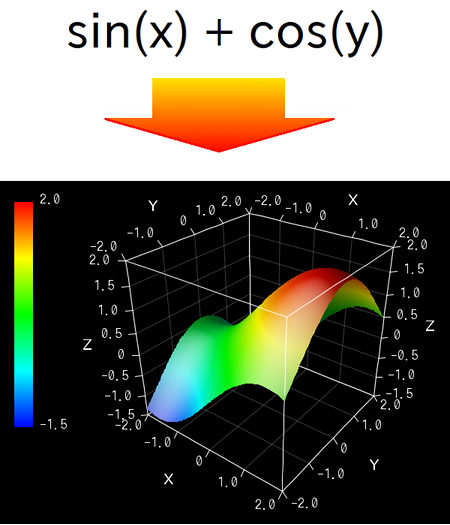
Generally, when people think of 3D graphs, they might envision graphs of mathematical expressions. Of course, RINEARN Graph 3D can also draw graphs of math expressions. It is also possible to animate 3D graphs of mathematical expressions that change over time.
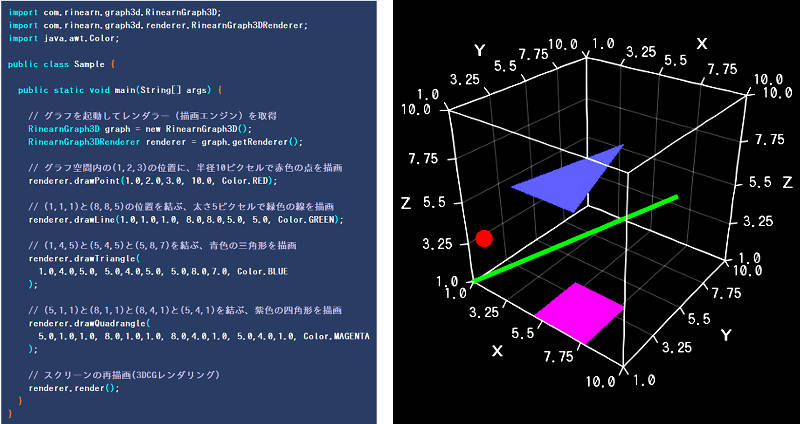
You can control RINEARN Graph 3D programmatically through its API, in Java or VCSSL. This allows for advanced usage, such as automating complex tasks or visualizing array data in real-time.
If necessary, you can directly control the 3D rendering engine to freely draw points, lines, surfaces, etc. in space. This versatility extends beyond traditional graphing software, allowing for applications such as embedding RINEARN Graph 3D into original apps to serve as a window for displaying 3D shapes.
RINEARN Graph 3D originated from a web tool called "Butsuri-kan Graph 3D," which was developed in 2007 as a hobby by the founder of RINEARN (Japanese) while still a university student.

Since then, after several major upgrades and name changes, it has been developed and made available for over 15 years.
Initially, its spread was modest and gradual, but since the release of Ver.5 in 2010, the user base started to expand, and it has become a slightly famous 3D graphing software in Japan (for which we are grateful!). Recently, there has been an increasing number of users from English-speaking countries, prompting initiatives to improve usability for international users.
The current latest release of RINEARN Graph 3D is Version 5.6.x. Meanwhile, development has already begun for the next major version, "Version 6." Version 6 is planned to be open-source software, aiming to be more freely usable in a wider range of fields. Completing Version 6 and facilitating the transition period from older versions to Version 6 are expected to take several years, but it marks a significant milestone in the evolution of RINEARN Graph 3D toward the future.
For the latest updates on RINEARN Graph 3D and the progress of the upcoming version 6, please check the "News" section on the RINEARN official website!

