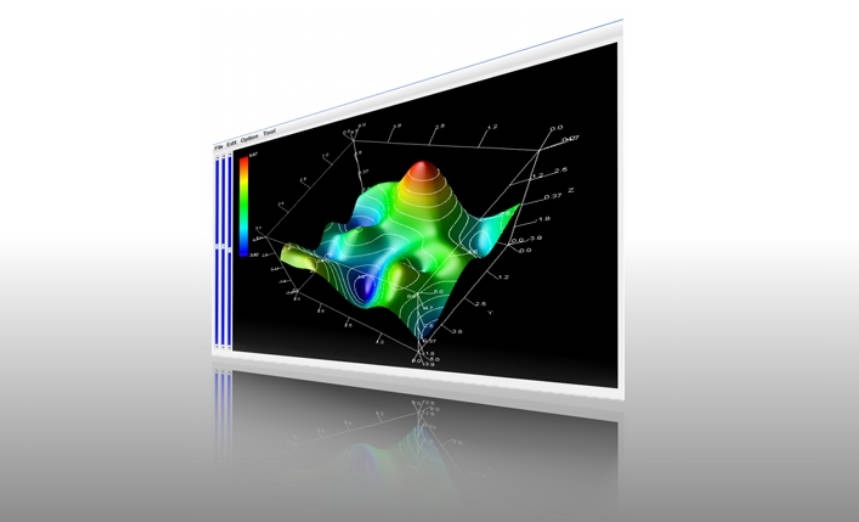
Recently, RINEARN released the latest versions of its graphing software, RINEARN Graph 3D and RINEARN Graph 2D, as well as the scripting language VCSSL, which provides control functions for these tools.
Starting with this update, a new "MANUAL" tick mode is now supported, allowing users to freely specify the positions and labels of ticks on the graph. In this article, we'll dive into the details of this new feature!
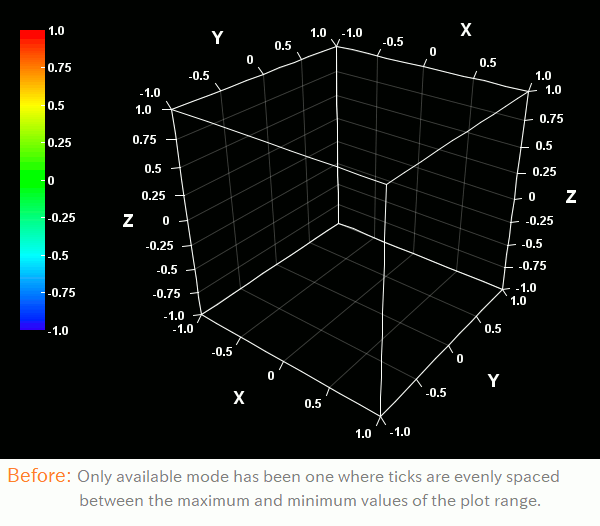
Before jumping into the details of this new feature, let's first take a look at the previous state of things.
RINEARN Graph is a graphing tool primarily designed for everyday use, such as during data analysis, rather than for creating polished visuals for presentations or publications. It assumes that for situations needing neat and good-looking graphs, users will rely on dedicated, aesthetics-focused graphing software.
This design philosophy stems from the fact that, while there are already numerous well-established options for high-quality graphing software, tools emphasizing ease of use for daily tasks are surprisingly scarce. Filling this gap is the primary role of RINEARN Graph.
That said, to be honest, this approach has sometimes been used as an excuse for neglecting improvements in finer aesthetic details. For example, enhancements related to "visual quality" often end up with lower priority and are postponed.
In fact, some crude features introduced in older versions have remained unchanged for quite a long time.
For those who have been using RINEARN Graph in their daily work, this is probably already well-known: the handling of "ticks" has remained largely unchanged since the initial versions.
Specifically, up until now, the only available mode has been one where ticks are evenly spaced between the maximum and minimum values of the plot range. While this mode can be convenient in certain scenarios, having only this single mode has been an overly simplistic approach. This was something we has long been aware of.
However, enhancing the rendering of ticks is relatively complicated and tricky. Since tick-related processes are deeply integrated with the core graph rendering, retrofitting improvements after the fact is a challenging and intricate task. As a result, these enhancements have been repeatedly postponed.
In the next-generation version, Ver.6, which is already under development, tick rendering has been prioritized for significant upgrades, allowing for much greater configurability. However, the official release of Ver.6 is still likely to be several years away.
Meanwhile, user requests and inquiries about tick rendering continue to come in. Recently, we even received a series of requests, one of which came from overseas. At this point, simply telling users to "wait for Ver.6 in a few years" has become untenable.
It turns out that tick rendering issues have been a much bigger hindrance to users than we, as the developer, had anticipated.
In light of these circumstances, we've decided to enhance tick rendering even in the current Ver.5 series to provide greater flexibility.
Although this might result in redundant effort alongside the development of Ver.6, we believe it's worth it considering that Ver.5 will still be in use for several years to come. Additionally, these enhancements can serve as a prototype, allowing us to gather early feedback from users.
Now, the improvements to tick rendering in RINEARN Graph will be implemented in several stages.
As the first step, we've introduced a "MANUAL" mode. This mode allows users to specify the positions and labels of ticks completely freely. For example, it enables configurations like the one shown below:
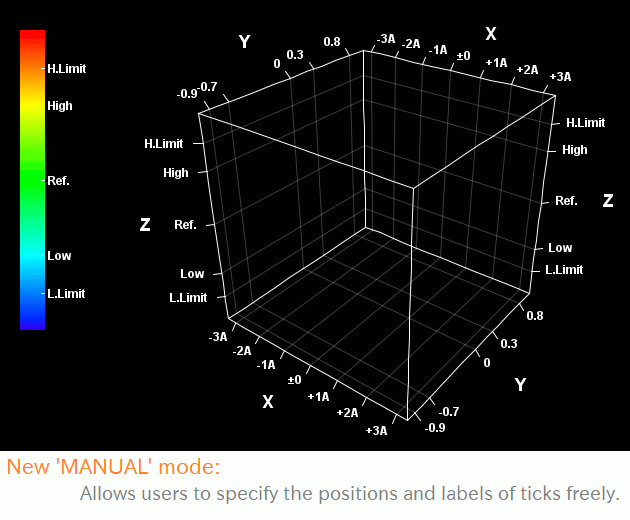
As illustrated, this mode lets you easily create tick configurations that were previously impossible, no matter how you tried.
However, in this mode, you must explicitly specify the positions and labels of the ticks every time, which can be inconvenient for regular use.
Still, as the first step of improvements, we prioritized flexibility, enabling users to create virtually any tick configuration that was previously unachievable.
In future updates, we plan to introduce additional modes that are more user-friendly, visually refined, and suitable for regular use.
To use this new mode, start by navigating to "Edit" > "Set Scale" > "Ticks" tab from the menu bar.
In the "Mode" dropdown, you'll see that the default setting is "EQUAL DIVISION", which corresponds to the previous mode. Change this setting to "MANUAL", the new mode introduced in this update.
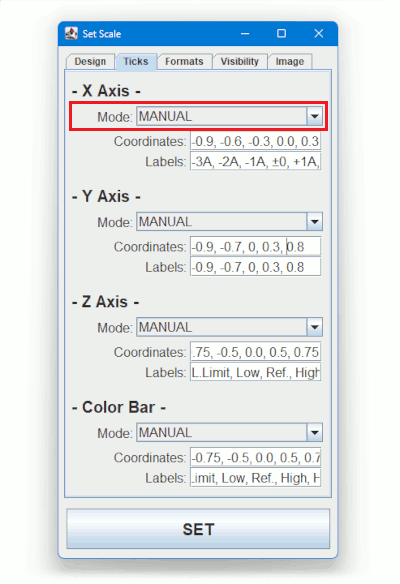
After selecting "MANUAL," input fields labeled "Coordinates" and "Labels" will appear. In the "Coordinates" field, enter the coordinates for tick positions, and in the "Labels" field, enter the corresponding tick labels, separated by commas (,).
Once you've entered the desired values, click the "SET" button to apply the changes to the graph. The results will look like the example shown earlier.
RINEARN Graph can be programmatically controlled, making it suitable for tasks such as automating the processing of large datasets, utilizing it as a graph rendering library, and more.
Alongside this update, we have added new functionalities to the programmatic control APIs, allowing users to freely configure the positions and labels of graph ticks.
Let's start with the Java control APIs. For details on how to use these APIs, please refer to the documentation for 3D graphs or documentation for 2D graphs.
In the 3D API, the following methods have been added to the top-level RinearnGraph3D class:
Similarly, for 2D graphs, the following methods have been added to the RinearnGraph2D class:
Next, let's look at the extended APIs for the scripting language VCSSL.
In the case of 3D graphs, the following functions have been added to the Graph3D library:
For 2D graphs, the following functions have been added to the Graph2D library:
The enhancements introduced in this update are as described above.
As mentioned in the main text, the tick rendering functionality of RINEARN Graph will be expanded in multiple stages. This update represents the first step, and we plan to add more modes in the future. We will keep you informed about these updates through this "News" section as they are released!