RINEARN
HOMEINFOSOFTTECHAICONTACT
RINEARN > English Top > RINEARN Graph 3D > User Guide
[ Prev | Index | Next ]
Japanese English

Graph Window and User Interface

Here, we will explain the window design of RINEARN Graph 3D and how to operate each part.

» Ask the AI for help (ChatGPT account required)
- Table of Contents -
  • Graph Window
  • Graph Screen
  • Dimension Length Bars
  • Menu Bar
  • Quick Setting Selector

Graph Window

When you launch RINEARN Graph 3D, a window containing a 3D graph screen like the one shown below will appear:

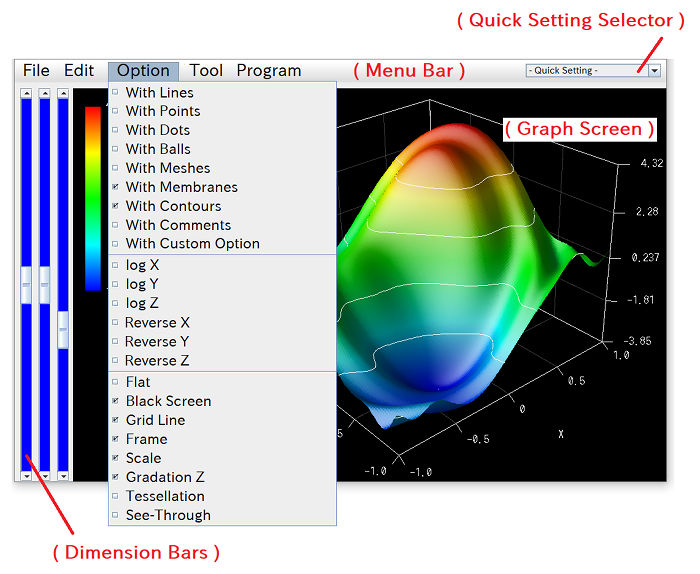
This is the "Graph Window." All operations within RINEARN Graph 3D begin from this window. While there are several other windows for various settings, you can access them from the menu bar located at the top of the graph window.

Below, we will introduce the various components found in the graph window and explain how to use them.

Graph Screen

The large area in the center of the window, where the 3D graph is displayed, is known as the "Graph Screen."

Mouse Controls

On the Graph Screen, you can intuitively explore and examine specific areas of interest by combining the following mouse operations:

Left Drag
This operation allows you to rotate the graph to change the viewing angle.
Right Drag
This action enables you to move the graph parallel to the screen in all directions.
Scroll Wheel
Using the scroll wheel, you can zoom in or out to adjust the magnification level.

Right-Click Menu

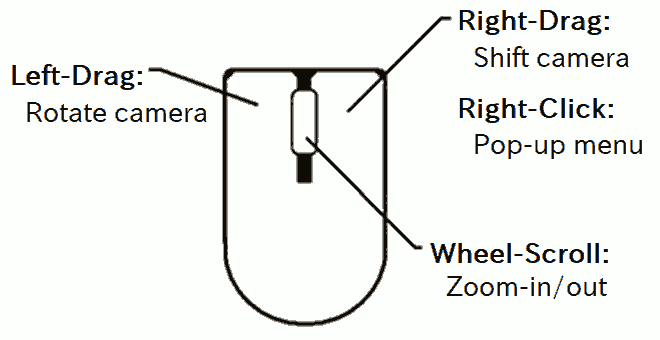
When you right-click on the Graph Screen, a context menu appears, offering useful functions for collaborative work with other software.

Copy Image
This function enables you to copy images from RINEARN Graph 3D and paste them directly into other software.
Paste Data
This option allows you to plot numerical data copied from other software directly onto the graph, without the need to create a file. For example, you can select and copy data in spreadsheet software and paste it directly into RINEARN Graph 3D for immediate visualization.

Dimension Length Bars

The three bars aligned on the left side of the Graph Screen are called "Dimension Length Bars." They allow you to adjust the length of the X, Y, and Z axes.

These bars are useful when you need to adjust the proportions of each axis on the graph or when you want to emphasize the concavity or convexity along a particular axis.

Note that setting the length of any axis to zero using these bars will flatten the graph. However, for such purposes, using the "Flat" option under the "Options" menu on the menu bar is more convenient.

Menu Bar

At the top of the window, there is a bar with items like "File," "Edit," "Option," and so on, known as the "Menu Bar." Each item on this bar is referred to as a "Menu."

Detailed settings for the graph and plot options (such as whether to plot points or connect them with lines) are adjusted by selecting the various menus on this Menu Bar. While a detailed explanation will be provided in the next section on Explanation of Various Menus, let's briefly introduce them here:

"File" Menu

This menu is used for file-related operations such as opening data files and saving/loading configuration files.

"Edit" Menu

This menu is designed for adjusting graph settings, such as specifying the ranges of each axis, formatting axis labels, and setting camera angles. However, for plot options, you should use the "Option" menu described below.

"Option" Menu

This menu contains ON/OFF style options related to how the graph is plotted. For instance, the "Point Plot" option allows you to decide whether to plot points at each coordinate position. Similarly, the "Line Plot" option enables you to choose whether to connect each coordinate value with lines.

"Tool" Menu

This menu provides auxiliary tools such as animation tools.

"Program" Menu

Here, you can execute scripts written in the lightweight programming language "VCSSL." With VCSSL, you can control RINEARN Graph 3D to perform tasks like automated processing and preprocessing of data. A detailed explanation will be provided in the Control and Automation with VCSSL section.

It's convenient to store frequently used VCSSL programs in the "RinearnGraph3DProgram" folder, as they can be easily accessed from this menu.

Quick Setting Selector

At the right end of the menu bar, there is an embedded selection box known as the "Quick Setting Selector." This selector allows you to quickly switch between multiple pre-saved settings.

Settings available for selection can be added by choosing "Quick Setting" as the save location under the "Save Setting" in the "File" menu. Alternatively, you can manually add and organize setting files in the "RinearnGraph3DQuickSetting" folder.


Japanese English
[ Prev | Index | Next ]
RINEARN > English Top > RINEARN Graph 3D > User Guide
  • Introduction
  • How to Launch RINEARN Graph 3D and Plot Graphs
  • Graph Window and User Interface
  • Menus
  • Data File Formats
  • Graphing Mathematical Expressions
  • Animation
  • Control and Automation with VCSSL
  • Controlling and 3D Drawing by Java Language
Index of this category
RINEARN > English Top > RINEARN Graph 3D > User Guide
[ Prev | Index | Next ]
  • Introduction
  • How to Launch RINEARN Graph 3D and Plot Graphs
  • Graph Window and User Interface
  • Menus
  • Data File Formats
  • Graphing Mathematical Expressions
  • Animation
  • Control and Automation with VCSSL
  • Controlling and 3D Drawing by Java Language
News

English Documentation for Our Software and VCSSL Is Now Nearly Complete
2025-06-30 - We're happy to announce that the large-scale expansion of our English documentation with the support of AI — a project that began two years ago — has now reached its initial target milestone.

VCSSL 3.4.52 Released: Enhanced Integration with External Programs and More
2025-05-25 - This update introduces enhancements to the external program integration features (e.g., for running C-language executables). Several other improvements and fixes are also included. Details inside.

Released: Latest Version of VCSSL with Fixes for Behavioral Changes on Java 24
2025-04-22 - VCSSL 3.4.50 released with a fix for a subtle behavioral change in absolute path resolution on network drives, introduced in Java 24. Details inside.

Released the Latest Versions of RINEARN Graph and VCSSL - Now Supporting Customizable Tick Positions and Labels!
2024-11-24 - Starting with this update, a new "MANUAL" tick mode is now supported, allowing users to freely specify the positions and labels of ticks on the graph. We'll explain the details and how to use it.

Released Exevalator 2.2: Now Compatible with TypeScript and Usable in Web Browsers
2024-10-22 - The open-source expression evaluation library, Exevalator, has been updated to version 2.2. It now supports TypeScript and can be used for evaluating expressions directly in web browsers. Explains the details.

Behind the Scenes of Creating an Assistant AI (Part 1: Fundamental Knowledge)
2024-10-07 - The first part of a series on how to create an Assistant AI. In this article, we introduce the essential knowledge you need to grasp before building an Assistant AI. What exactly is an LLM-based AI? What is RAG? And more.

Launching an Assistant AI to Support Software Usage!
2024-09-20 - We've launched an Assistant AI that answers questions about how to use RINEARN software and helps with certain tasks. Anyone with a ChatGPT account can use it for free. We'll explain how to use it.

Software Updates: Command Expansion in RINEARN Graph, and English Support in VCSSL
2024-02-05 - We updated our apps. This updates include "Enhancing the Command-Line Features of RINEARN Graph" and "Adding English Support to VCSSL." Dives into each of them!

» View More Articles
See Our News
on Twitter !
RINEARN Official Website | Top Page | Privacy Policy |
This website uses cookies for serving ads and analyzing traffic data. By continuing to use this website, you agree to our privacy policy.
This website is managed by RINEARN. All rights to the contents of this website are owned by RINEARN and its owner.
Copyright(C) RINEARN 2009 - 2025 All rights reserved.