


RINEARN Graph 2D
RINEARN Graph 2D is a simple 2D graphing software that can plot 2D scatter plots and line graphs from files created by numerical calculation programs or spreadsheet software. It is compatible with various operating systems, requires no installation, and is available for free.
Available on Various PC Operating Systems!
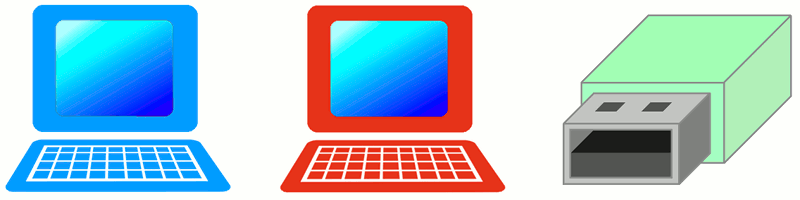
RINEARN Graph 2D is a graphing software developed in the Java® language, and it can be used on various PC operating systems (not available for smartphones), including Microsoft® Windows® and Linux. Since no installation is required, you can use it as your regular graphing software or even carry it on a USB memory stick for use on the go.
If you are using Windows, simply double-click the "RinearnGraph2D_..*.bat" (batch file, * represents the version number) in the downloaded and extracted folder to launch the program. On the first run, it will automatically download the necessary Java runtime environment (JRE). If you are using Linux or another operating system, you can launch it by executing "RinearnGraph2D.jar" with the "java -jar" command in a terminal.
* In either case, if you add the path of the "bin" folder from the downloaded and extracted files to the "Path" (or "PATH") environment variable, you can launch the program by using the "ring2d" command in a terminal.
Easily Create Graphs from Spreadsheet Software!
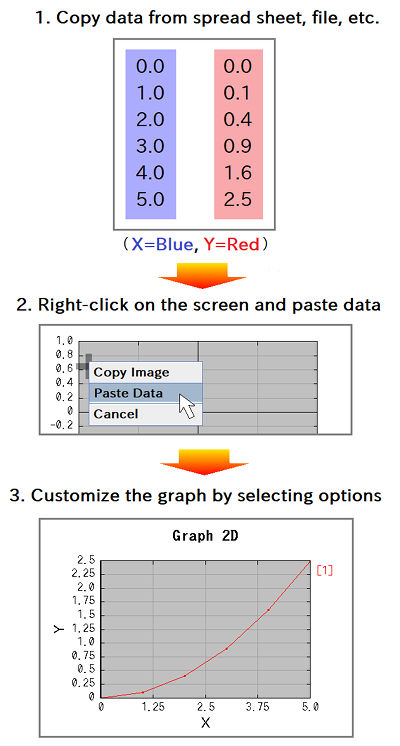
With RINEARN Graph 2D, you can not only load data from files but also easily create graphs from data in spreadsheet software like Microsoft® Excel®!
To do this, simply download and launch RINEARN Graph 2D, select and copy the data from your spreadsheet, then right-click on the graph screen and choose "Paste Data" to instantly generate a graph.
For details on data formatting, refer to the Data File Format Guide. If you save the data as a text file, you can open and load it from the "File" menu at the top of the graph screen.
Easy Operation for Everyday Use!
RINEARN Graph 2D is designed as a simple plotting tool, focusing on being lightweight and easy to use, rather than being a feature-heavy graphing software for creating complex diagrams. It adopts a user-friendly interface centered around a menu bar and mouse operations for simple and intuitive use.
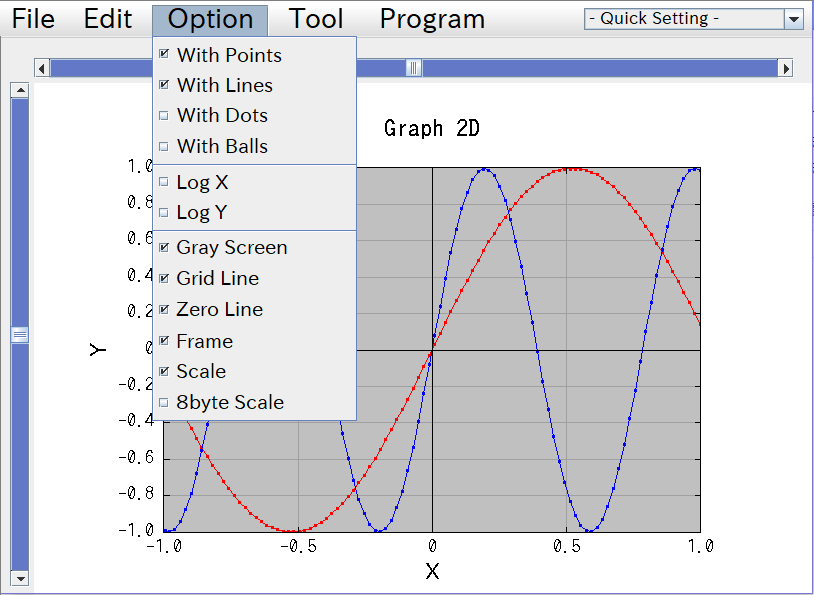
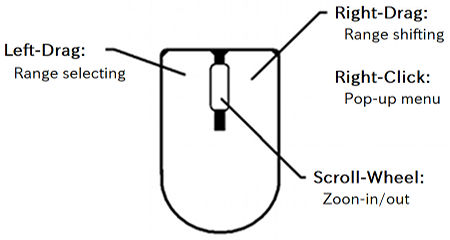
With mouse operations, you can move the plot area freely in any direction by dragging with the left mouse button. You can also select an arbitrary plot area by dragging with the right mouse button, and zoom in or out intuitively using the scroll wheel.
Additionally, the interface is designed to be consistent with the 3D graph version, RINEARN Graph 3D, so if you are already familiar with that software, you'll feel right at home using this one too.
Easy Animation!
Like its sibling software RINEARN Graph 3D, RINEARN Graph 2D also supports animation features. You can use modes that animate multiple graph data series over time or modes that gradually plot points while tracking their coordinates.
Animating data from a single file is as simple as opening the data file and selecting "Tools" > "Animation" from the menu bar.
Additionally, there is a tool available under the "Program" menu that allows you to sequentially read and animate multiple data files with sequentially numbered names. It also supports saving the animated sequence as image files!
This tool is implemented in the VCSSL scripting language, which is natively supported by RINEARN Graph. You can also download and use it as a standalone tool from the link below:
| 2D Graph Animation Tool for Sequential Files | |
|
|
This tool reads sequentially numbered data files in a folder, rapidly renders 2D graphs in sequence, and animates them. It also supports saving the graphs as sequential image files. |
Math Plotting Tool Included!
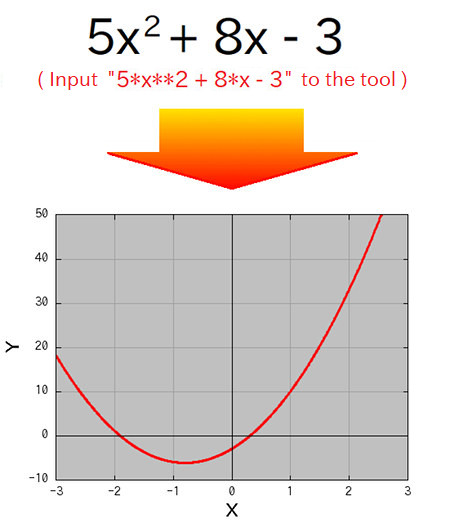
RINEARN Graph 2D comes with a built-in tool for plotting graphs from various mathematical expressions.
The math plotting tool is implemented in the VCSSL scripting language, which is natively supported by RINEARN Graph. You can also download and use it as a standalone tool from the links below:
| Tool for Plotting y = f(x) as a 2D Graph | |
|
|
This simple tool allows you to input a formula in the form y = f(x) and plot it as a 2D graph. |
| Tool for Animating y = f(x, t) as a 2D Graph | |
|
|
By inputting a formula in the form y = f(x, t), this tool treats t as time and animates the 2D graph. |
| Tool for Plotting and Animating Parametric Equations x(t), y(t) as a 2D Graph | |
|
|
This tool lets you input parametric equations x(t) and y(t), treating t as the parameter to plot and animate the 2D graph. |
In RINEARN Graph 2D, you can easily use these tools by selecting "y(x)," "y(x,t)," or "x(t), y(t)" from the "Formula Plot" folder under the "Program" menu.
Programmatic Control and Rendering Available!
RINEARN Graph 2D can also be controlled from programs written in Java or the VCSSL scripting language, allowing it to be used as a graph rendering library.
This is useful not only for automating tasks such as "loading data from a file, rendering a graph, and saving an image," but also for using RINEARN Graph 2D as a data visualization component to create custom software or applications.
VCSSL, in particular, is fully supported as the standard scripting feature for automating processes in RINEARN Graph, so you can run programs from the "Program" menu in RINEARN Graph 2D without needing any additional development or runtime environment.
The official VCSSL site also offers plenty of sample code for controlling RINEARN Graph 2D:
| Plotting data from a file on a 2D graph | |
|
|
A sample program that plots the contents of a coordinate data file on a 2D graph. |
| Plotting an array on a 2D graph | |
|
|
A sample program that plots the contents of a coordinate array on a 2D graph. |
| Animating an array on a 2D graph | |
|
|
A sample program that continuously plots an array of coordinate values on a 2D graph and animates it. |
Additionally, there are VCSSL programs available for more advanced uses, such as displaying RINEARN Graph 2D as part of an application:
| Animating a sine wave | |
|
|
A program that lets you control the amplitude, wavelength, and period with sliders to view an animated sine wave graph. |
| Animating the interference of sine waves on a line | |
|
|
A program that animates the interference of sine waves along a one-dimensional line, allowing you to adjust parameters. |
| Simulating waves using a mechanical algorithm (waves on a string) | |
|
|
A simulation of one-dimensional waves, approximating the medium with springs and lattice points, driven by a mechanical algorithm. |
| Simulating manual wave generation | |
|
|
A simulation where you generate waves by moving sliders with the mouse. |
Wallpaper Feature
You can also use the "Wallpaper Feature" to display an image as the background of your graph. This can be useful for adding an explanatory image to your graph or simply for a change of scenery while working.
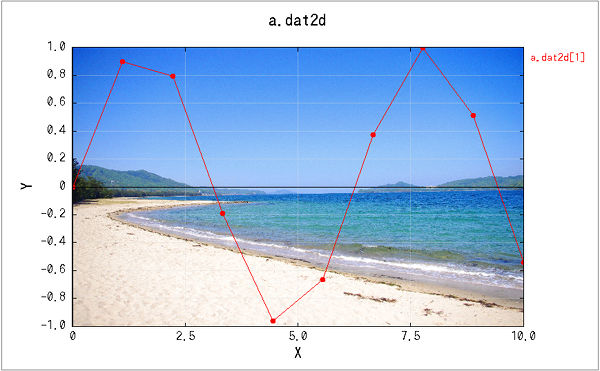
It's easy to use: just place a JPEG image file named "RinearnGraph2DScreen" (with the .jpg extension) in the RINEARN Graph 2D folder, and it will be loaded and displayed as the wallpaper when the software starts.
License
Now, Let's Get Started!
Download the Latest Version of RINEARN Graph 2D
RINEARN Graph 2D is available for free to everyone.

If you are using Windows, simply right-click the downloaded ZIP file to extract it, then double-click "RinearnGraph2D.bat" (batch file) inside to start using it immediately, anywhere.
» For detailed instructions or if you are using another operating system, click here.
» If you encounter errors (including ZIP extraction failures) and cannot start the software, click here.
» Download previous versions
* Please note that previous versions are no longer under development or maintenance. We recommend using the latest version unless you have a specific reason.
- Oracle and Java are registered trademarks of Oracle and/or its affiliates. Other names may be trademarks of their respective owners.
- Microsoft Windows is either a registered trademarks or trademarks of Microsoft Corporation in the United States and/or other countries.
- Linux is a trademark of linus torvalds in the United States and/or other countries.
- Other names may be either a registered trademarks or trademarks of their respective owners.